Bitcoin Might Retreat Before Rallying to 100K: Key Levels to Watch for Dip-Buyers
BTC/USD
+5.92%
Add to/Remove from Watchlist
Add to Watchlist
Add Position
Position added successfully to:
Please name your holdings portfolio
Type:
BUY
SELL
Date:
Amount:
Price
Point Value:
Leverage:
1:1
1:10
1:25
1:50
1:100
1:200
1:400
1:500
1:1000
Commission:
Create New Watchlist
Create
Create a new holdings portfolio
Add
Create
+ Add another position
Close
BTC/USD
+5.80%
Add to/Remove from Watchlist
Add to Watchlist
Add Position
Position added successfully to:
Please name your holdings portfolio
Type:
BUY
SELL
Date:
Amount:
Price
Point Value:
Leverage:
1:1
1:10
1:25
1:50
1:100
1:200
1:400
1:500
1:1000
Commission:
Create New Watchlist
Create
Create a new holdings portfolio
Add
Create
+ Add another position
Close
Three weeks ago, see here, we found for Bitcoin (BTC/USD), based on our Elliott Wave Principle (EWP) analyses,
“We don’t expect that [the March 4th] intra-day pullback of 14.8% was all BTC/USD will experience before rallying to the $100-200K level, but that a deeper multi-day correction to around ~$54+/-2K should be around the corner.”
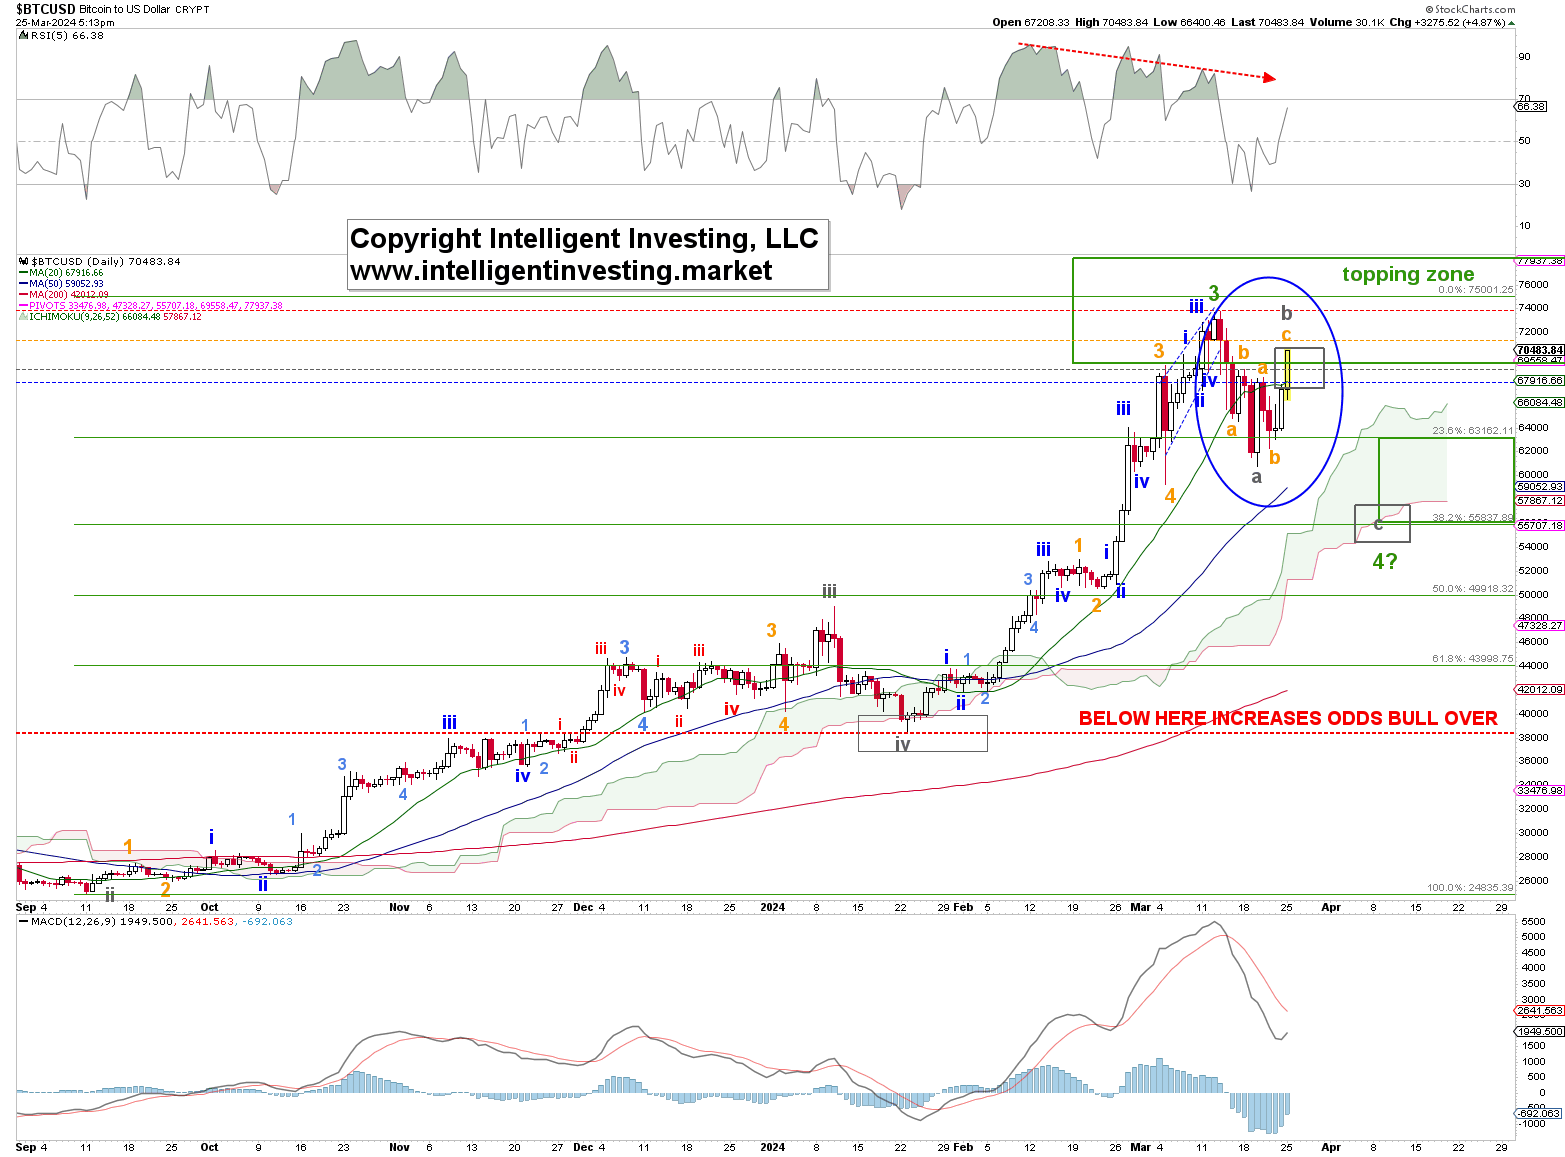
BTC/USD rallied for another eight days to $73672, dropping to $60782 on March 20th. See Figure 1 below. Since corrections (2nd, 4th, and B-waves) always move in at least three waves, W-a, -b, and -c, we expect that low to be grey W-a of the green W-4, and the current rally to be grey W-b, with a final grey W-c to ideally $54-57K yet to follow.
The latter target zone matches the 38.20% retracement of the green W-3 rally at $55080 well—a typical retrace target for a 4th wave. Moreover, the current rally from the March 30th low is, so far, still only three (orange a, b, c) waves up right into the ideal grey W-b target zone after three orange waves down: see the blue oval in Figure 1 below.
Figure 1: The Daily Chart of BTC/USD with Several Technical Indicators and a Detailed EWP Count.
 BTC/USD-Daily Chart
In our last update, we looked at previous corrections and found that
“”
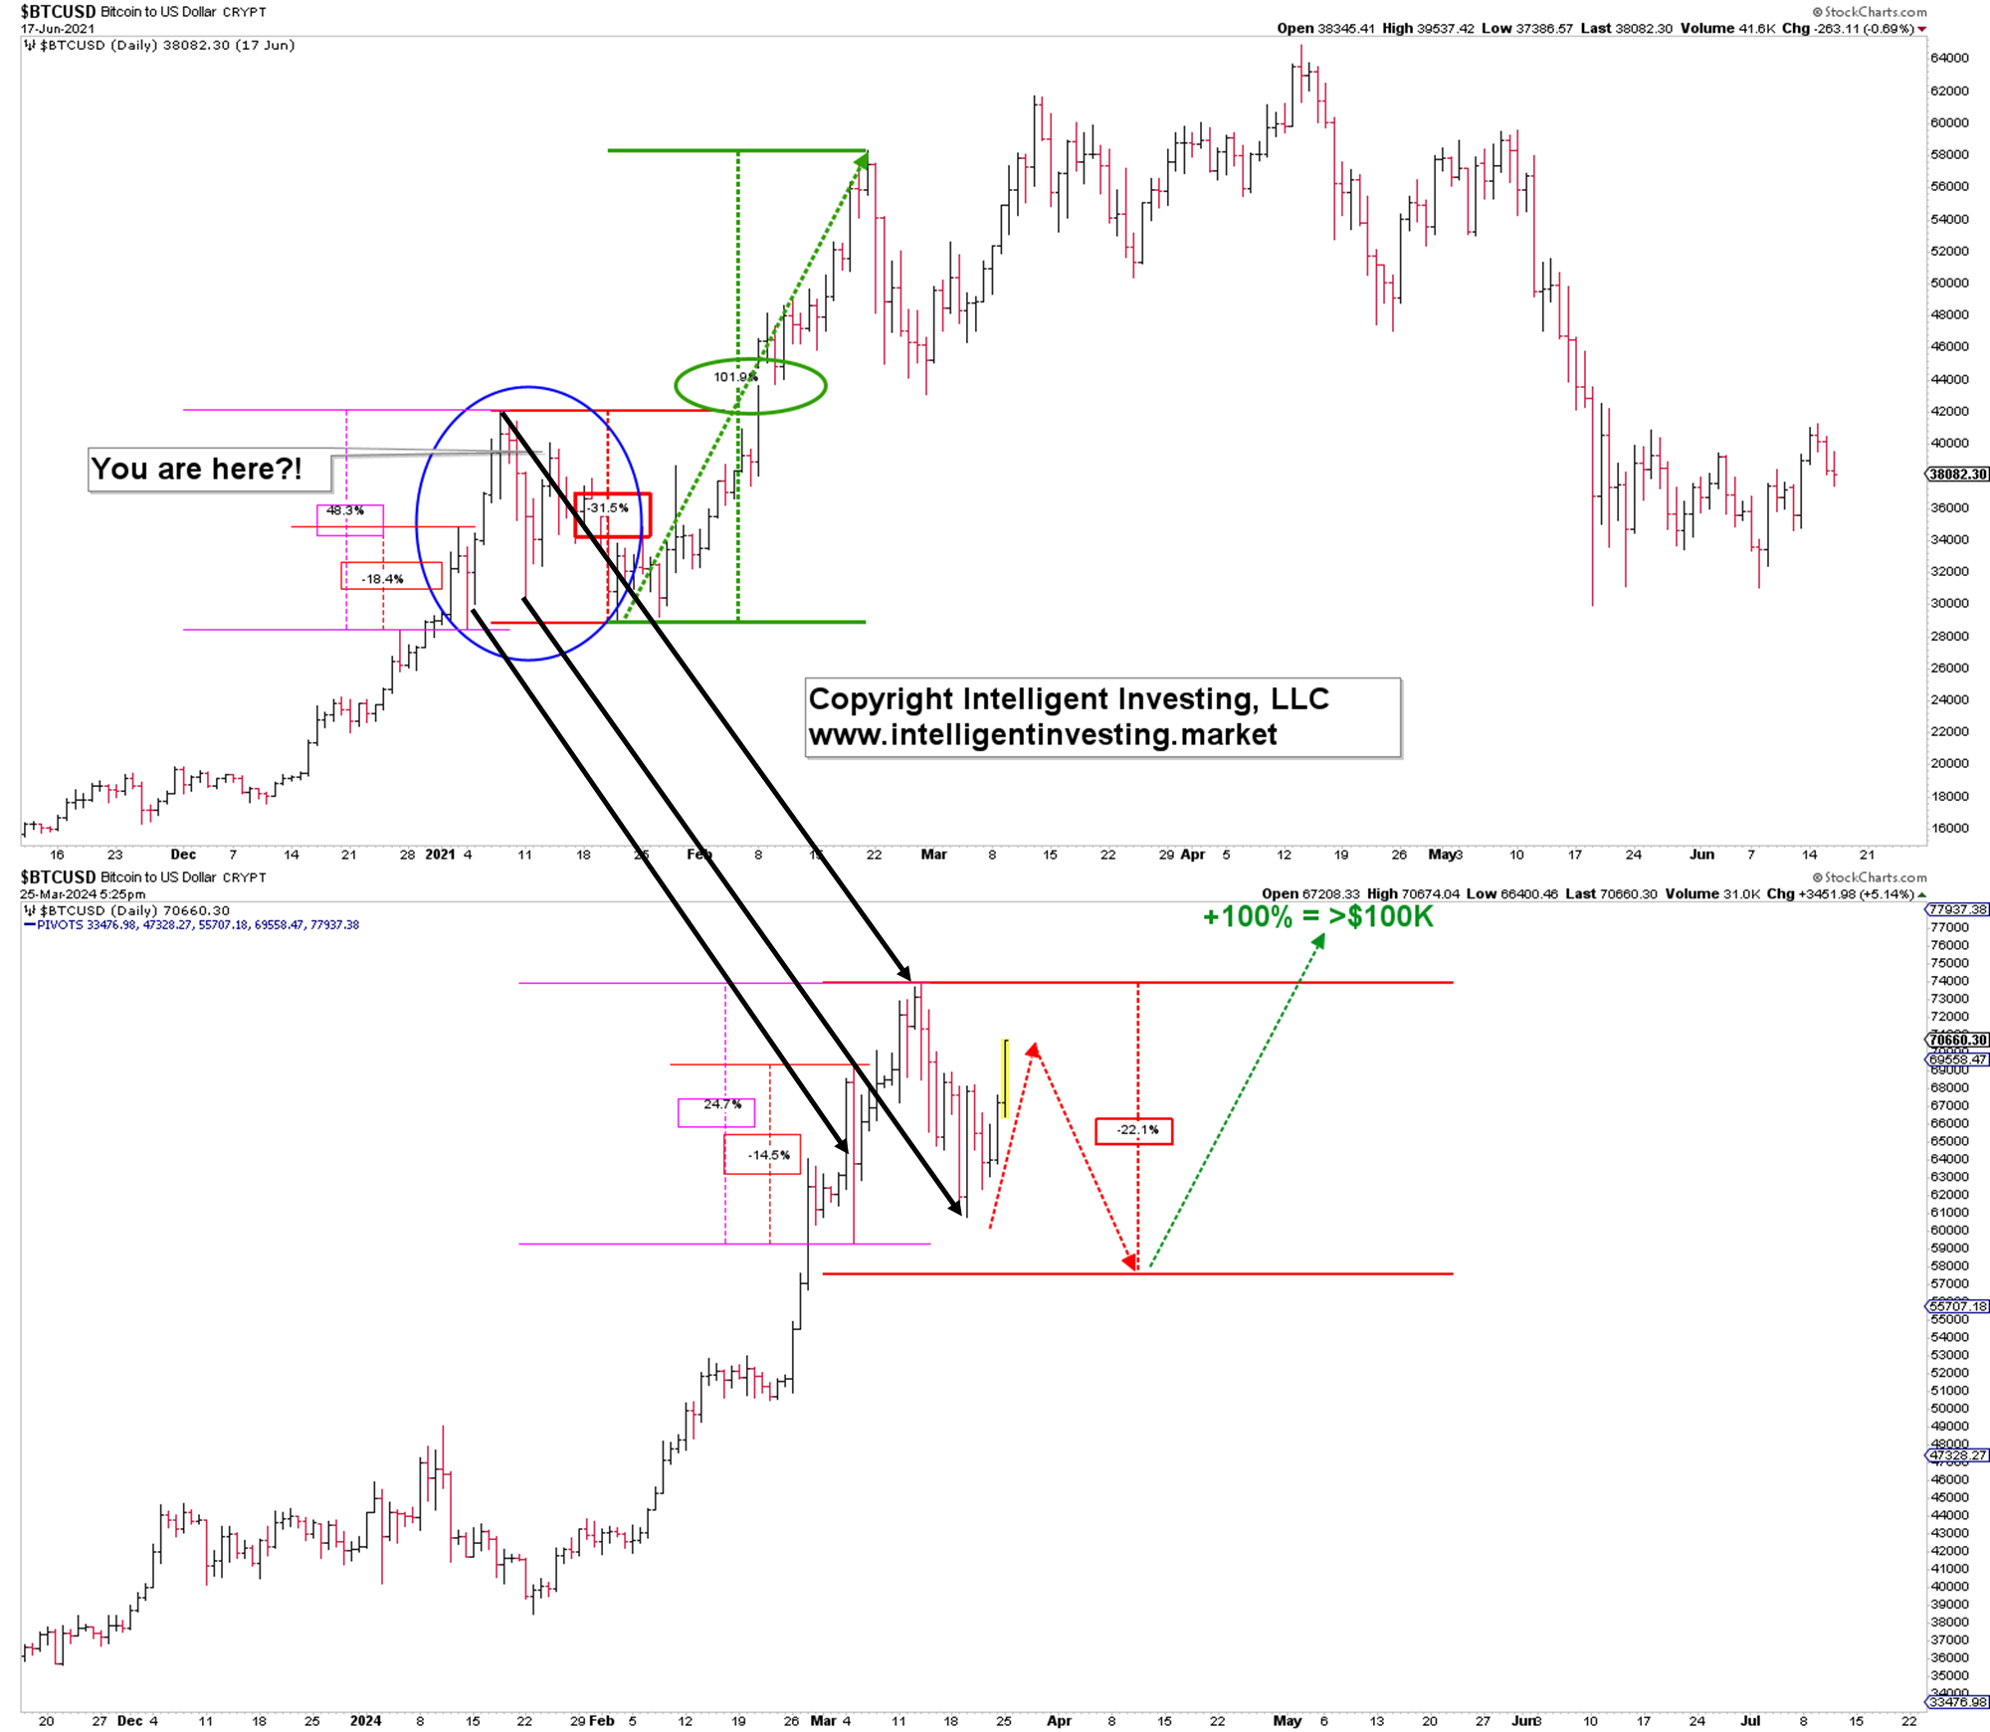
In greater detail, in early January 2021, see Figure 2 below, BTC/USD experienced a ~18.4% drop in less than one-and-a-half days (red), rallied 48.3% in four days (purple), dropped 31.5% over the next two weeks (thick red), to then stage a >100% rally (thick green). See Figure 2 below.
Figure 2: BTC/USD in 2021 vs. Now:.
 BTC/USD-Daily Chart
Now, using the black arrows, BTC/USD experienced a 14.5% correction one-day pullback, a seven-day 24.7% rally, and so far, a 17.9% decline to the March 20th low, which is a little less than the average 22-23%. If we apply that, we should expect BTC/USD to bottom out at around $57.5K, close to the level as mentioned earlier of $55080 and the $54-57K target zone for the grey W-c.
Of course, BTC/USD does not have to follow the same path as in 2021 and could have already bottomed out. Hence, we have the colored warning levels on the chart to tell us if that is increasingly likely. Or, more likely, it may provide us with a flat (3-3-5) correction, which targets ~$74+/-1K first, then drops back to ~$60+/-1K before liftoff. Regardless, we remain Bullish over the long-term for BTC and expect it to reach at least $100K, with an adjusted upside target of $150+/-25K.


