Nasdaq, S&P 500, Russell 2000 Sound ‘Bull Trap’ Alarm
US500
-1.02%
Add to/Remove from Watchlist
Add to Watchlist
Add Position
Position added successfully to:
Please name your holdings portfolio
Type:
BUY
SELL
Date:
Amount:
Price
Point Value:
Leverage:
1:1
1:10
1:25
1:50
1:100
1:200
1:400
1:500
1:1000
Commission:
Create New Watchlist
Create
Create a new holdings portfolio
Add
Create
+ Add another position
Close
US2000
-0.99%
Add to/Remove from Watchlist
Add to Watchlist
Add Position
Position added successfully to:
Please name your holdings portfolio
Type:
BUY
SELL
Date:
Amount:
Price
Point Value:
Leverage:
1:1
1:10
1:25
1:50
1:100
1:200
1:400
1:500
1:1000
Commission:
Create New Watchlist
Create
Create a new holdings portfolio
Add
Create
+ Add another position
Close
IWM
-0.96%
Add to/Remove from Watchlist
Add to Watchlist
Add Position
Position added successfully to:
Please name your holdings portfolio
Type:
BUY
SELL
Date:
Amount:
Price
Point Value:
Leverage:
1:1
1:10
1:25
1:50
1:100
1:200
1:400
1:500
1:1000
Commission:
Create New Watchlist
Create
Create a new holdings portfolio
Add
Create
+ Add another position
Close
IXIC
-1.65%
Add to/Remove from Watchlist
Add to Watchlist
Add Position
Position added successfully to:
Please name your holdings portfolio
Type:
BUY
SELL
Date:
Amount:
Price
Point Value:
Leverage:
1:1
1:10
1:25
1:50
1:100
1:200
1:400
1:500
1:1000
Commission:
Create New Watchlist
Create
Create a new holdings portfolio
Add
Create
+ Add another position
Close
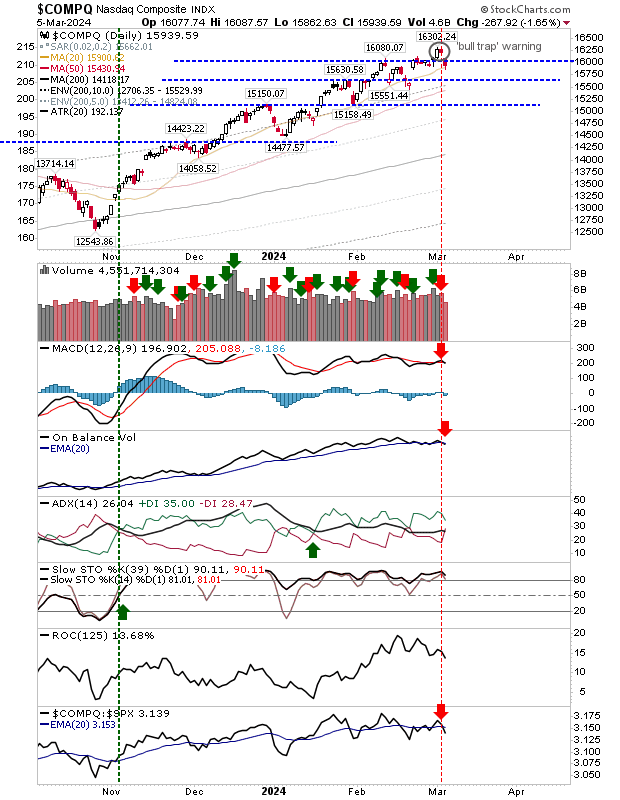
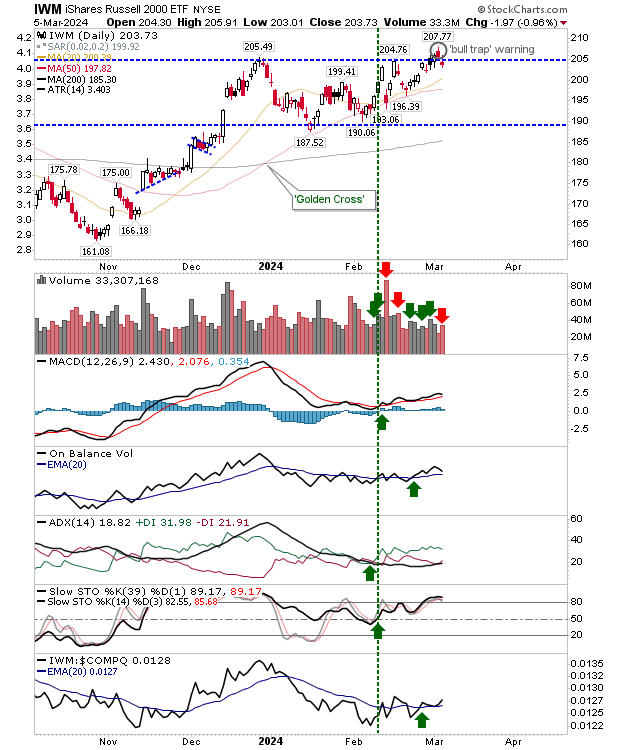
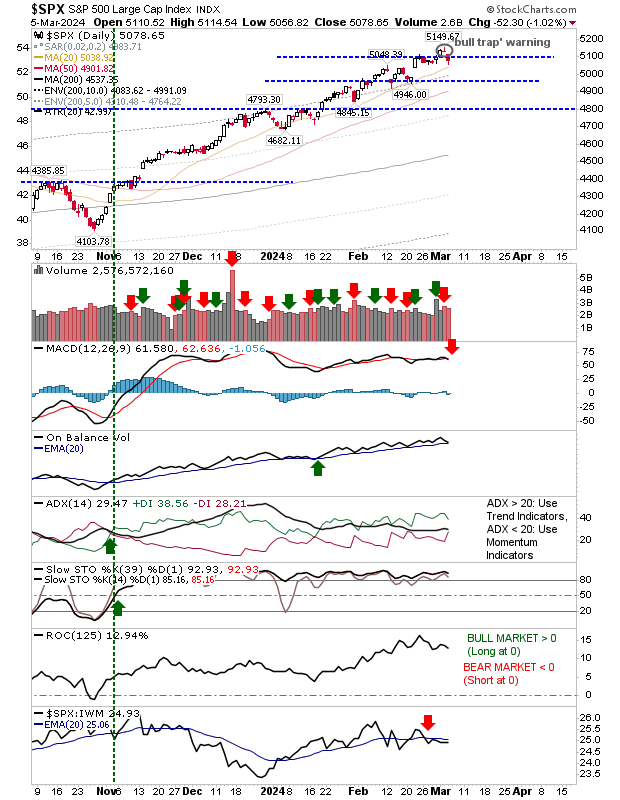
A couple of days ago we were looking at breakouts, now we need to be watchful for ‘bull traps’. We had the first triggers for one with the undercut of breakout support.
The next few days will be critical as to whether these undercuts end as ‘bull traps’, but for now, consider these short signals with stops above the breakout highs.
For the Nasdaq, the ‘bull trap’ came with ‘sell’ triggers in the MACD, On-Balance-Volume, and relative performance to the S&P 500.
 COMPQ-Daily Chart
The Russell 2000 (IWM) didn’t suffer the same technical breakdown as the Nasdaq, but it did experience heavier volume distribution (although the volume itself wasn’t that heavy).
The index is still outperforming the Nasdaq and S&P 500 despite the loss.
 IWM-Daily Chart
The S&P 500 is caught a little in the middle with a ‘sell’ trigger in a MACD that has effectively flatlined, but other technicals are still positive.
 SPX-Daily Chart
Up until now, rallies have been honoring support on subsequent tests. Yesterday marked the first real failing of such support.
However, there remains support to be found at 20-day MAs, and these moving averages are likely to see such tests today or Thursday at the latest.


