Market Overview
S&P 500 E-Mini Breaks Out Above All-Time High
ESH24
-0.11%
Add to/Remove from Watchlist
Add to Watchlist
Add Position
Position added successfully to:
Please name your holdings portfolio
Type:
BUY
SELL
Date:
Amount:
Price
Point Value:
Leverage:
1:1
1:10
1:25
1:50
1:100
1:200
1:400
1:500
1:1000
Commission:
Create New Watchlist
Create
Create a new holdings portfolio
Add
Create
+ Add another position
Close
Market Overview: S&P 500 Emini Futures
The monthly chart formed an S&P 500 Emini breakout above the prior all-time high. The bulls will need to create a follow-through bull bar in March to confirm the breakout even if it is just a bull doji. The bears will need a strong sell signal bar or a micro double top before traders will be willing to sell more aggressively.
S&P 500 Emini Futures Emini Monthly Chart
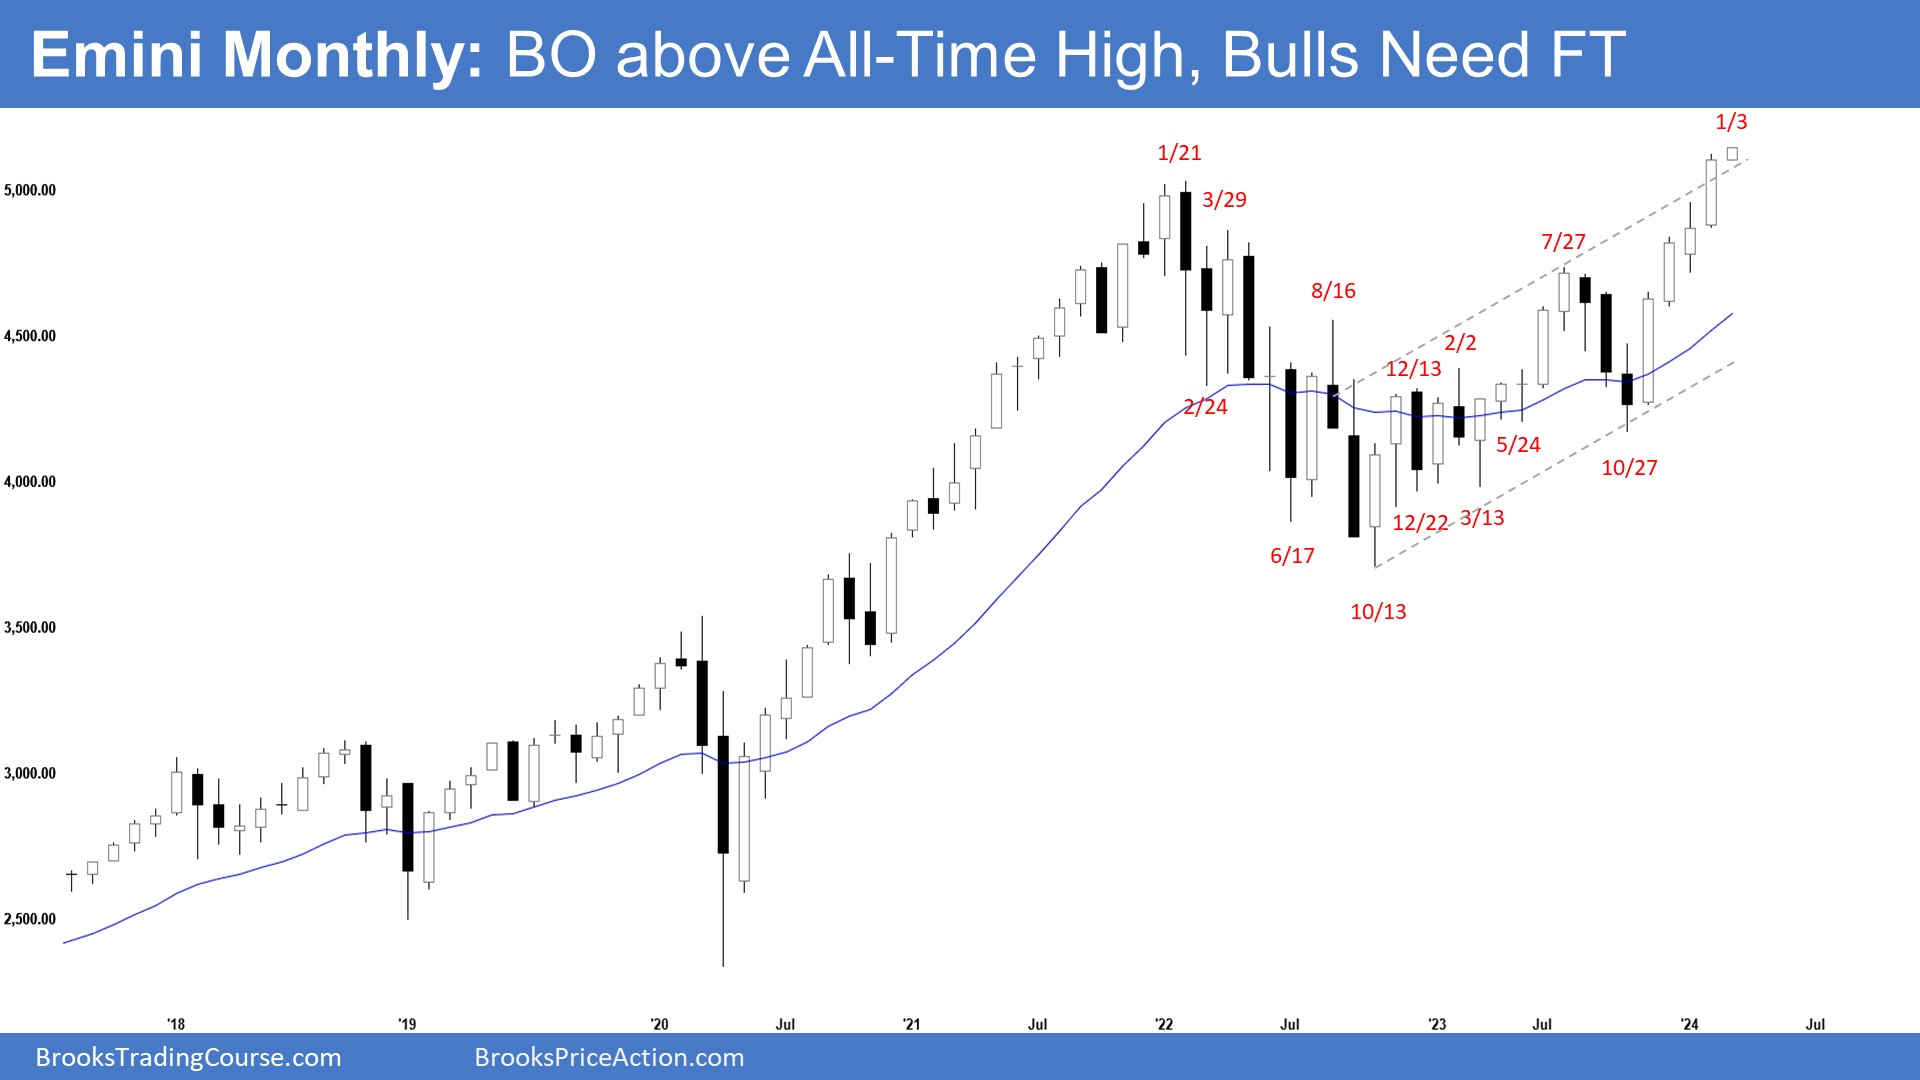
- The February monthly Emini candlestick was another consecutive big bull bar closing above the all-time high.
- Last month, we said that the odds slightly favor February to trade at least a little higher. However, the rally has also lasted a long time and is slightly climactic and a minor pullback can begin within a few months before the market resumes higher.
- The bulls want a breakout above the all-time high and got it in February.
- They will need to create a follow-through bull bar in March to confirm the breakout even if it is just a bull doji.
- If the market trades lower, they want it to be sideways with overlapping candlesticks.
- The bears see the current rally as a retest of the January 2022 all-time high and want a reversal from a higher high major trend reversal.
- They also see a large wedge pattern (Dec 2, July 27, and Mar 1).
- Because of the strong rally in the last 4 months, they will need a strong sell signal bar or a micro double top before traders would be willing to sell more aggressively. So far, there is no strong signal bar yet.
- Since February closed near its high, it is a buy signal bar for March.
- For now, odds slightly favor March to trade at least a little higher.
- The market remains Always In Long and the bull trend remains intact (higher highs, higher lows).
- The rally has lasted a long time and is slightly climactic. Traders are looking for signs of a pullback. There are none yet.
- Until the bears can create a strong sell signal bar, odds continue to favor the market to trade sideways to up.
S&P 500 Emini Weekly Chart
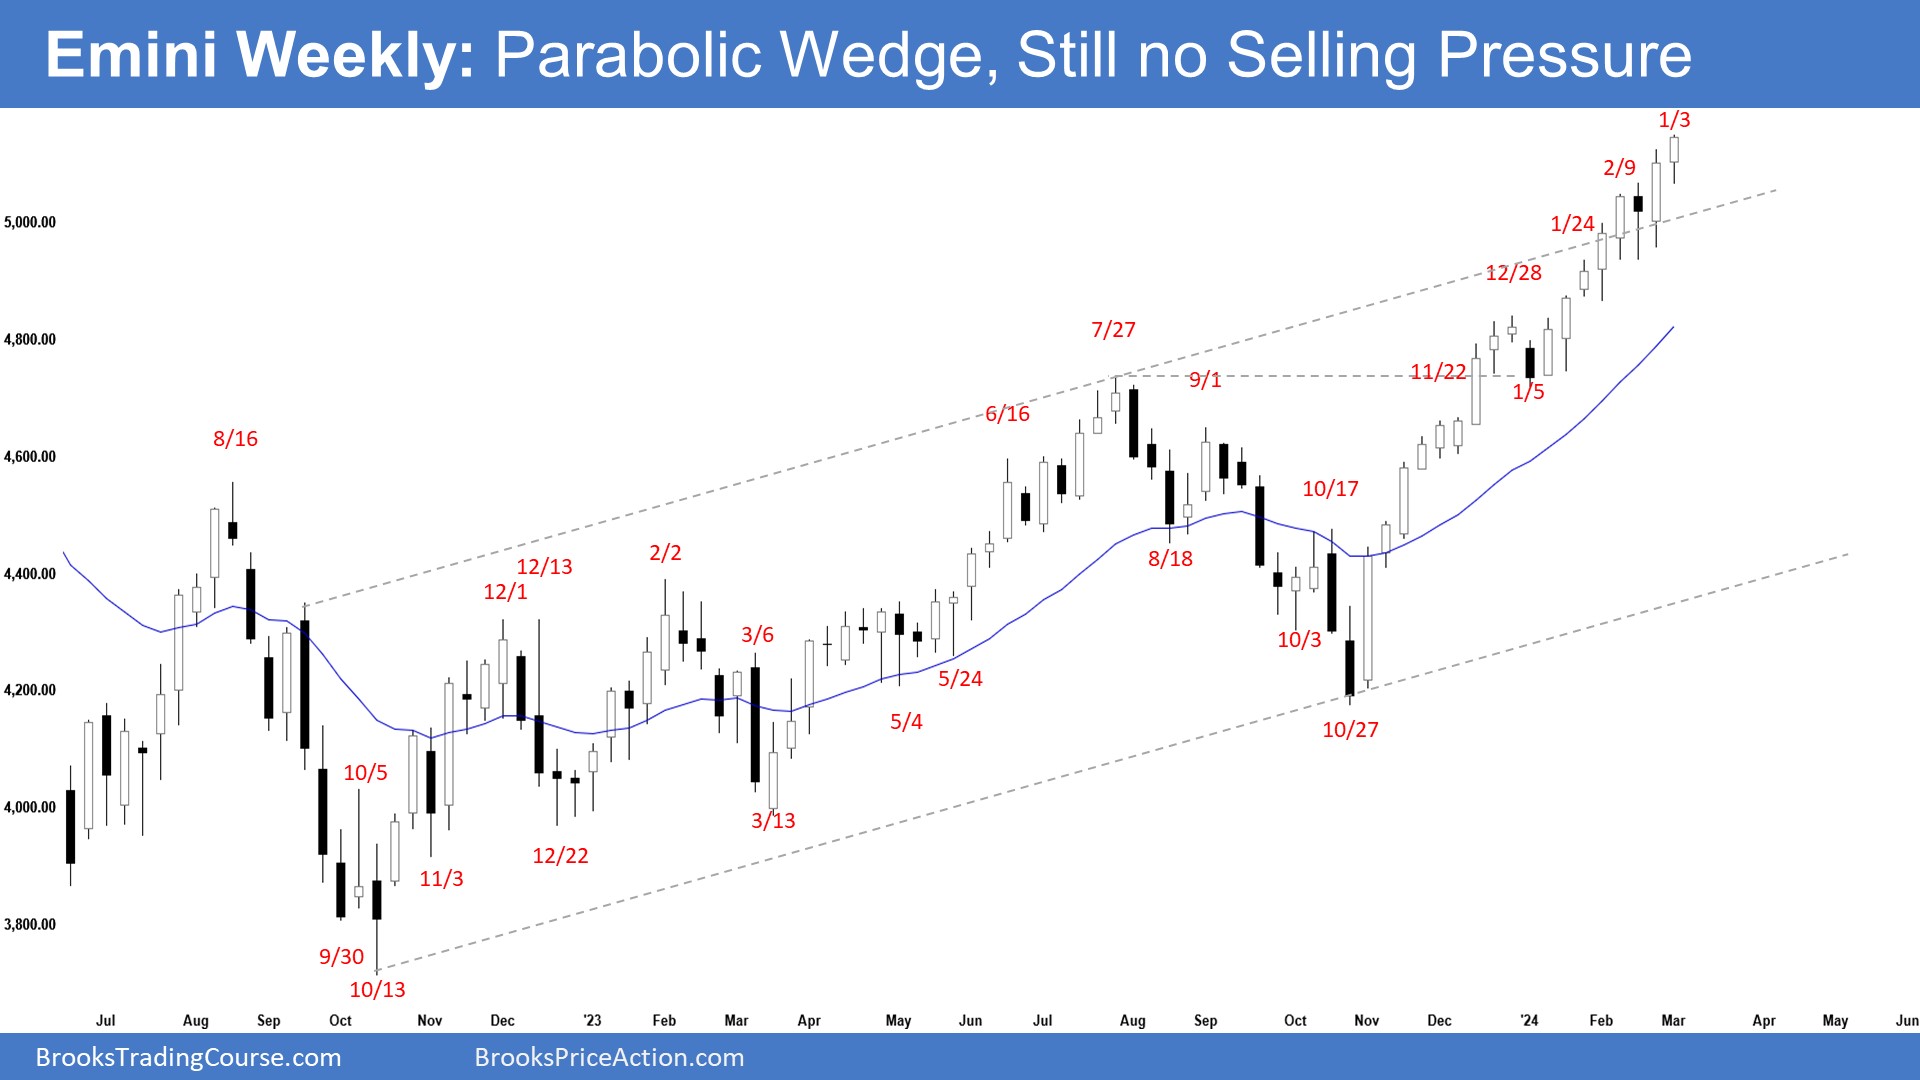
- This week’s Emini candlestick was a bull bar closing near its high.
- Last week, we said that while the market continues to be Always In Long, the rally has lasted a long time and is slightly climactic. Traders will see if we start to get more selling pressure or will the bulls continue to create follow-through buying.
- This week traded sideways to down earlier in the week but reversed higher by the end of the week. The bears are still not able to create any selling pressure.
- The bulls have a tight bull channel. That means strong bulls.
- They want a strong breakout into a new all-time high territory, hoping that it will lead to many months of sideways to up trading.
- They will need to continue to create sustained follow-through buying above the prior all-time high.
- We may also see some profit-taking activity once the market starts to stall.
- If a pullback begins, the bulls want it to be sideways and shallow, filled with bull bars, doji(s) and overlapping candlesticks.
- The bears hope that the strong rally is simply a buy-vacuum test of the prior all-time high.
- They want a reversal from a higher high major trend reversal and a large wedge pattern (Feb 2, July 27, and Mar 1). They want a failed breakout above the all-time high and the trend channel line.
- They also see a parabolic wedge in the third leg up since October (Nov 22, Dec 28, and Mar 1) and an embedded wedge (Jan 24, Feb 9, and Mar 1).
- They hope to get a TBTL (Ten Bars, Two Legs) pullback of at least 5-to-10%. They want at least a test of the 20-week EMA.
- The problem with the bear’s case is that the rally is very strong. They would need to create a few strong bear bars to indicate that they are at least temporarily back in control. So far, they have not yet been able to do so.
- Since this week’s candlestick is a bull bar closing near its high, it is a buy signal bar for next week.
- The market continues to be Always In Long and odds slightly favor the market to trade at least a little higher.
- The rally has lasted a long time and is slightly climactic. Traders are looking for signs of a minor pullback but there are none still.
- The bears continue to fail creating any selling pressure.
- Until the bears can create strong bear bars, traders will not be willing to sell aggressively.
- Sometimes, a euphoric market (as it is now) can continue higher into a blow-off top (parabolic climax).
- Traders will see if the bulls continue to create more follow-through buying.


