10-Year Bond: Surge Is Temporary as Disinflationary Trend Isn’t Dead
US10Y…
+0.10%
Add to/Remove from Watchlist
Add to Watchlist
Add Position
Position added successfully to:
Please name your holdings portfolio
Type:
BUY
SELL
Date:
Amount:
Price
Point Value:
Leverage:
1:1
1:10
1:25
1:50
1:100
1:200
1:400
1:500
1:1000
Commission:
Create New Watchlist
Create
Create a new holdings portfolio
Add
Create
+ Add another position
Close
The US 10-year Treasury yield spiked yesterday following the release of hotter-than-expected consumer inflation data in January.
The news also convinced the market that the Federal Reserve would push the first interest rate cut for this cycle later into the year.
But a fresh run of “fair value” modeling continues to suggest that the 10-year yield is elevated relative to macro conditions.
The bond market, however, disagrees, which has been true for months.
The sharp rise in the 10-year yield on Tuesday to 4.31% (Feb. 13) — the highest level in nearly three months – reflects a disagreement that went into overdrive yesterday.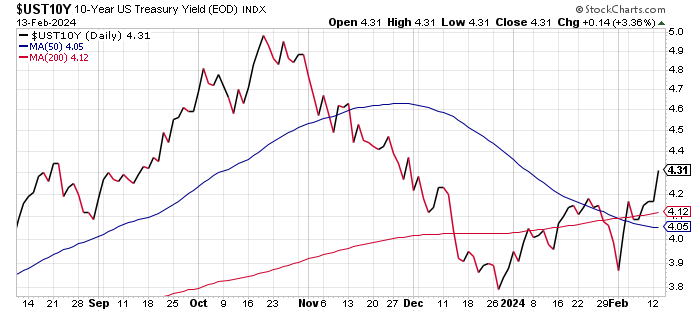 US 10-Yr Yield-Daily Chart
This is a good time to remind you that in the short term, the market can and will overshoot (and undershoot) fundamentals so it’s possible, perhaps likely, that the lower fair value estimate for the 10-year rate won’t be realized anytime soon.
Models of the type used below aren’t designed for market timing or short-term speculation, but they are useful for deciding where the bias lies for the rates outlook.
On that basis, several macro-based models suggest that there’s the 10-year yield still faces headwinds to the upside.
The latest data show that the market-based 10-year rate, at 4.31%, is more than a full percentage point above the 3.12% fair-value estimate for January, based on the average for three models (defined here).
Note, too, that this fair-value estimate in the low-3% range has been relatively steady in recent months. In other words, the big picture for macro conditions hasn’t changed much.
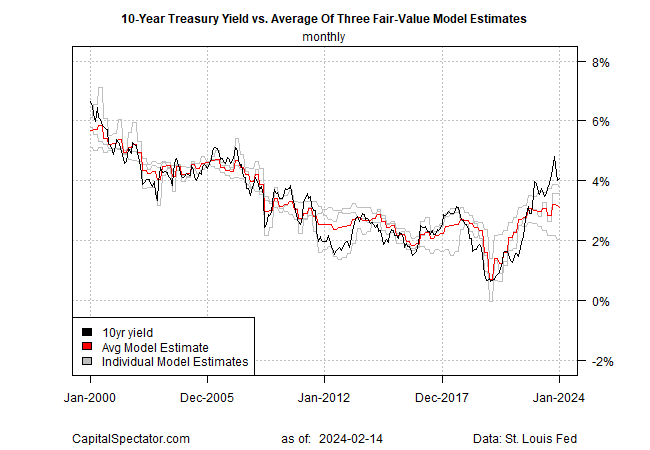 10 Yr Yield vs Avg. of 3 Fair Value Model Estimates-Monthly
Meanwhile, the market continues to price the 10-year rate at a premium to what one version of fair modeling suggests.
That’s not unusual—as the chart above reminds us, the market has routinely delivered premiums and discounts to the average model estimate through time.
The current premium run is longer and more dramatic than usual, but unless there’s been a radical regime change in how the market interacts with macro conditions, likely, the unusually widespread will likely eventually narrow.
For a clearer view of how this discount/premium evolves, the next chart below tracks the spread between the actual 10-year yield and the average model estimate.
Note that the extreme premium of late pulled back in January. The question is whether yesterday’s inflation news and the yield spike will change the calculus and trend in the months ahead.
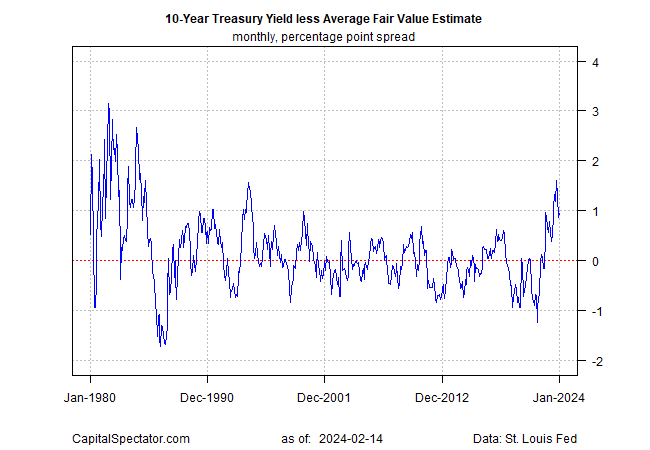 10 Yr Yield less Avg. Fair Value Estimate-Monthly
There are several reasons for thinking that the 10-year yield will remain constrained by the fair-value estimate. For starters, disinflation continues, even if it wasn’t obvious in yesterday’s inflation report.
A broader reading of inflation indexes, including several alternative measures, suggests that while the decline in inflation pressures is slowing, it will persist, albeit in fits and starts.
In short, a reflationary run doesn’t look likely, at least not at this point. Sticky inflation, however, has refocused the market’s expectations on how fast inflation will slow from current levels and how soon the Fed will start cutting interest rates.
On both counts the market has recalibrated expectations, and rightly so. But it’s still premature to decide that the disinflation trend is dead and that the 10-year yield is set for an ongoing upside U-turn.
What would change this outlook? A rise in the average fair-value estimate and consumer expectations for inflation for starters. For now, neither of those reversals is showing up in the numbers.
On Monday, the New York Fed reported that consumers’ median inflation expectations were stable and relatively modest in January, for example.
Sure, yesterday’s CPI data could mark a turning point of reflation. It’s happened before – notably in the mid-1970s. A broad review of indicators suggest that a repeat performance isn’t unfolding today.
But if that view is wrong, we’ll see the evidence accumulate via income data in the days and weeks ahead. My calculated risk estimate, however, suggests that the odds are still low that a new run of reflation has started.


