Russell 2000 Breakout Support Remains Intact; Nasdaq, S&P 500 Bull-Trap Risks Fade
US500
-0.29%
Add to/Remove from Watchlist
Add to Watchlist
Add Position
Position added successfully to:
Please name your holdings portfolio
Type:
BUY
SELL
Date:
Amount:
Price
Point Value:
Leverage:
1:1
1:10
1:25
1:50
1:100
1:200
1:400
1:500
1:1000
Commission:
Create New Watchlist
Create
Create a new holdings portfolio
Add
Create
+ Add another position
Close
US2000
-1.90%
Add to/Remove from Watchlist
Add to Watchlist
Add Position
Position added successfully to:
Please name your holdings portfolio
Type:
BUY
SELL
Date:
Amount:
Price
Point Value:
Leverage:
1:1
1:10
1:25
1:50
1:100
1:200
1:400
1:500
1:1000
Commission:
Create New Watchlist
Create
Create a new holdings portfolio
Add
Create
+ Add another position
Close
IWM
-1.82%
Add to/Remove from Watchlist
Add to Watchlist
Add Position
Position added successfully to:
Please name your holdings portfolio
Type:
BUY
SELL
Date:
Amount:
Price
Point Value:
Leverage:
1:1
1:10
1:25
1:50
1:100
1:200
1:400
1:500
1:1000
Commission:
Create New Watchlist
Create
Create a new holdings portfolio
Add
Create
+ Add another position
Close
IXIC
-0.30%
Add to/Remove from Watchlist
Add to Watchlist
Add Position
Position added successfully to:
Please name your holdings portfolio
Type:
BUY
SELL
Date:
Amount:
Price
Point Value:
Leverage:
1:1
1:10
1:25
1:50
1:100
1:200
1:400
1:500
1:1000
Commission:
Create New Watchlist
Create
Create a new holdings portfolio
Add
Create
+ Add another position
Close
The earlier ‘bull trap’ risks look safely put to bed as yesterday’s losses just dipped into the day before yesterday’s gains.
The S&P 500 moved into a period of outperformance relative to the Russell 2000 (IWM), although it came with higher volume (distribution) selling.
The MACD is still on a ‘sell’ trigger, although it has flat-lined for most of 2024.
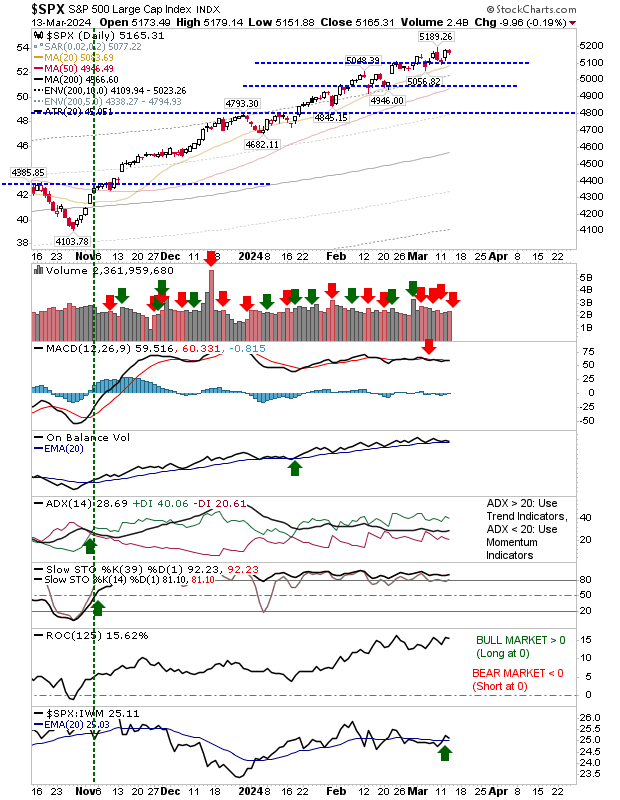 SPX-Daily Chart
The Nasdaq is working through a more substantial ‘bearish engulfing pattern’, but without the higher volume distribution of the S&P 500.
It has ‘sell’ triggers in the MACD and On-Balance-Volume to work off, in addition to a relative underperformance to the S&P 500 (but not the Russell 2000).
 SPX-Daily Chart
The Russell 2000 ($IWM) is perhaps the index most vulnerable to further selling given it has finished on breakout support.
The breakout remains intact, but further losses and a loss of the 20-day MA would signal something worse; a move back to $190 would seem to be the most likely outcome of a loss of breakout support.
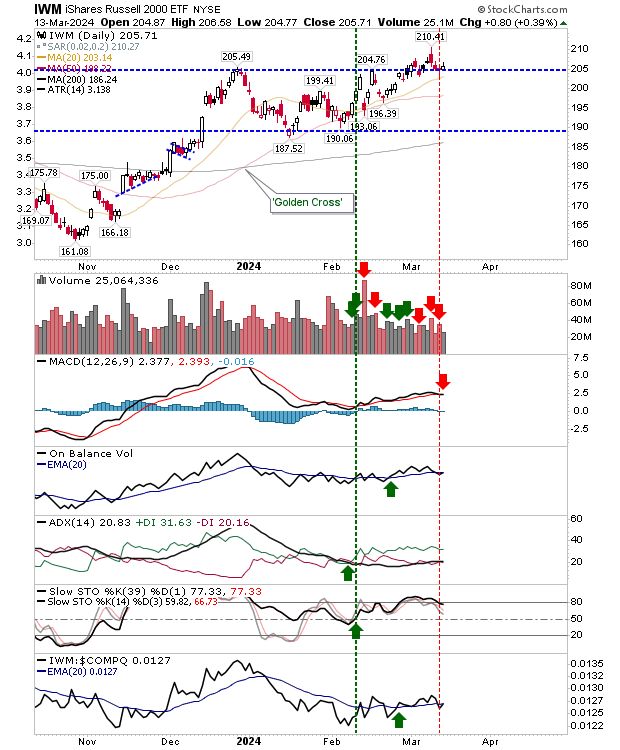 IWM-Daily Chart
The Russell 2000 ($IWM) is the index that typically leads bull and bear markets. At the moment, it’s still on the bull’s side, but if there is a loss of breakout support before the end of the week then play it more cautiously for the Nasdaq and S&P 500.