What Is Crude Oil Waiting For?
CL
+0.24%
Add to/Remove from Watchlist
Add to Watchlist
Add Position
Position added successfully to:
Please name your holdings portfolio
Type:
BUY
SELL
Date:
Amount:
Price
Point Value:
Leverage:
1:1
1:10
1:25
1:50
1:100
1:200
1:400
1:500
1:1000
Commission:
Create New Watchlist
Create
Create a new holdings portfolio
Add
Create
+ Add another position
Close
Thursday’s price action left behind important short-term clues on the chart. Who will use them to their advantage?
Technical Picture of Crude Oil
Briefly: in my opinion, no positions are justified from the risk/reward point of view at the moment of writing these words.
Let’s start today’s analysis with the medium-term picture of crude oil.
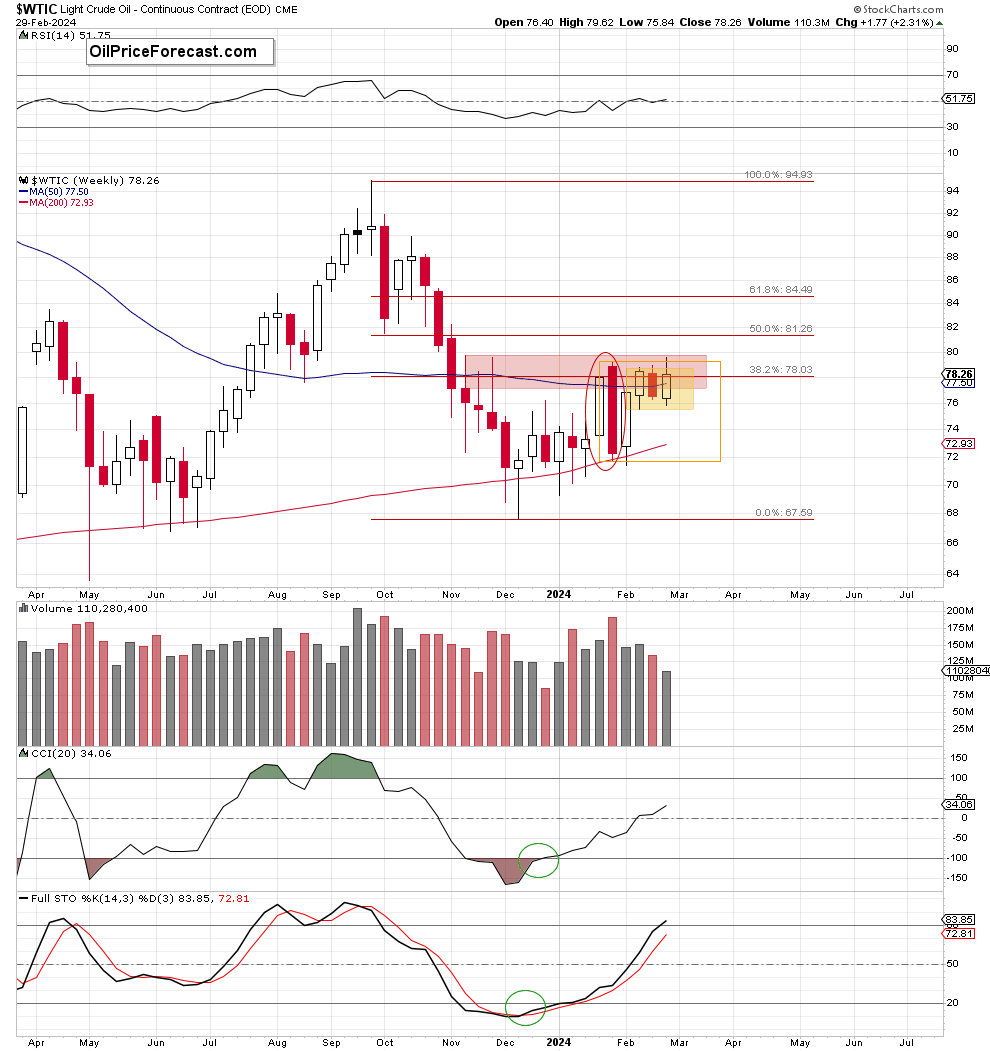 WTIC-Weekly Chart
Looking at the weekly chart, we see that although crude oil extended gains this week, breaking above the upper border of the yellow and orange consolidations, this improvement was very temporary, and the commodity pulled back, finishing yesterday’s session under both lines.
In this way, light crude invalidated earlier breakouts (a negative sign), but this development will turn into more bearish only if we see a weekly closure inside both consolidations (and preferably even below the 38.2% Fibonacci retracement).
Nevertheless, the assumptions about the next bigger move that I wrote about in Tuesday’s Oil Price Forecast for March 2024 remain up to date also today:
Crude oil is currently still trading inside two consolidations: the bigger one (marked with orange) based on the body of the red declining candlestick formed in the week started on Jan.29 and the smaller one (marked with yellow) within the white candle started on Feb.12.
Therefore, it seems that another bigger move will be more likely and reliable if the commodity breaks above the upper borders of consolidations or even below the lower line of the yellow formation.
At this point, however, it is worth mention that the way to the north is not wide open as the red resistance zone based on the previous peaks and reinforced by the mentioned 50-week moving average, the 38.2% Fibonacci retracement and the bearish engulfing pattern continues to keep gains in check.
So, what could happen if the bears manage to push the price under the lower line of the yellow consolidation?
We’ll likely see (at least) a test of the 200-week moving average (currently at $72.93). However, if the bulls do not manage to hold this support, we could see a move even to $72.27, where the size of the downward move would correspond to the height of the consolidation.
What’s interesting, in this area is also the lower border line of the above-mentioned bearish engulfing pattern in terms of weekly closures ($72.28) and slightly below it – the lower line of the bigger (orange) consolidation ($71.79), which could act as a magnet for sellers when buyers are weak.
And how the recent price action affected the short-term picture of black gold?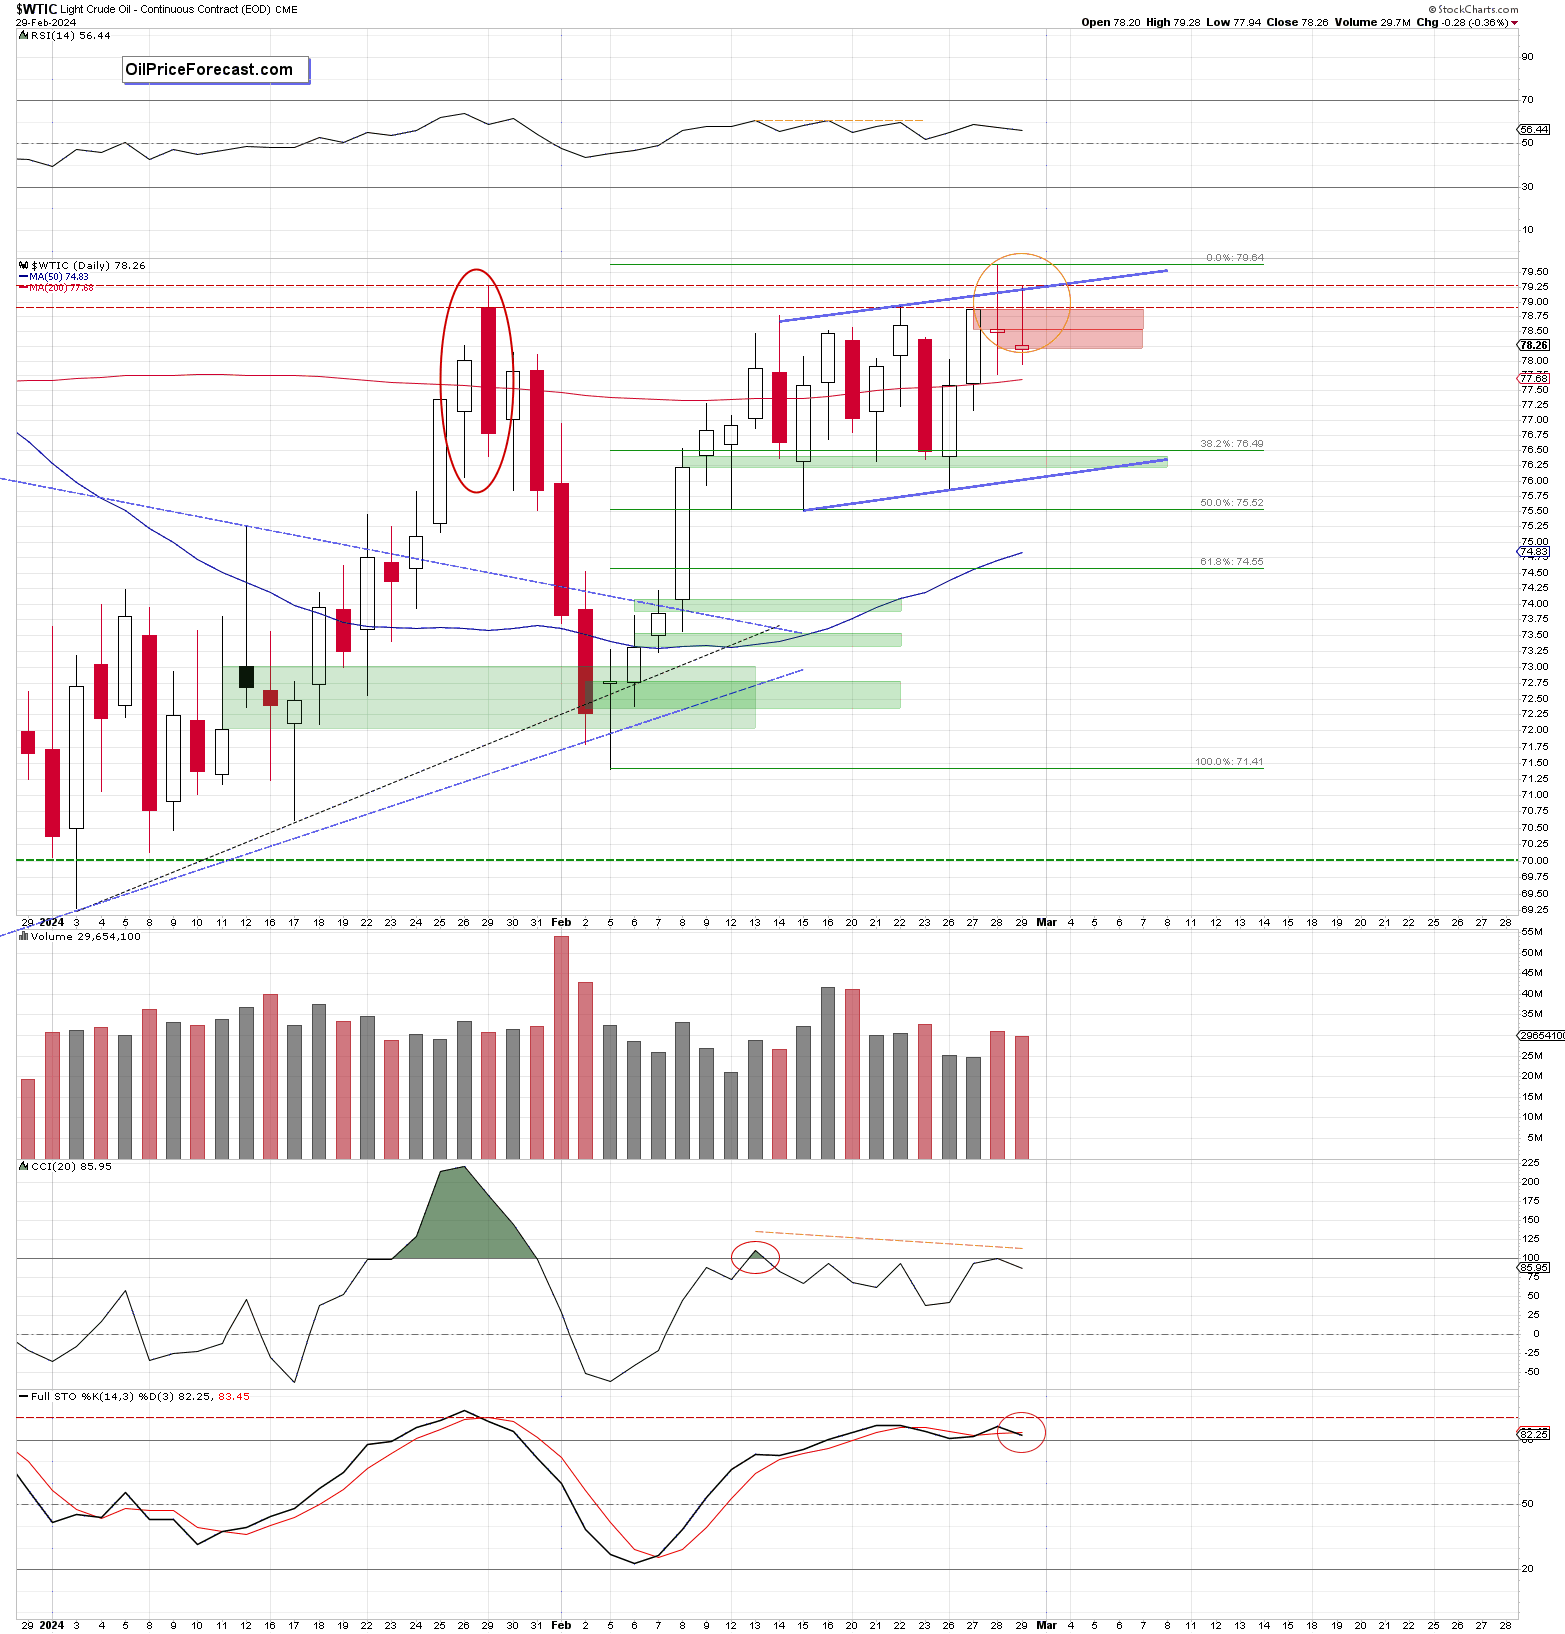 WTIC-Daily Chart
Before we find the answer to this question on the chart, let’s recall the quote from Tuesday’s Oil Price Forecast for March 2024:
Haven’t We Seen Something Like This Before?
Of course, we did! Even twice: on Feb. 15 (an intraday high of $78.07) and on Feb.21 (an intraday high of $78.05).
In both previous cases, such price action appeared after the successful defense of the green price gap. Additionally, yesterday (just like in the previous cases) crude oil pulled back before the session closure only to finish the day above the previously broken 200-day moving average. What an interesting similarity to the past!
What happened during the next session in the previous cases?
We could observe a higher open, a pullback and further improvement, which finally left a white candle on the chart.
Will history repeat itself again? Looking at yesterday’s volume, the chance of a pullback during today’s session is quite high because as you can see it was visibly lower than during Friday’s decline, which raises some concerns about the power of buyers.
Nevertheless, it is worth keeping in mind that similar drop in volume we could observe on Feb. 21 and it didn’t stop the bulls from fighting again for higher prices.
Therefore, connecting the dots, it seems that we could see another session similar to what we have already seen in the past, and more precisely to what took place on Feb.22.
If this is the case, and crude oil moves higher today, the target for the buyers would be probably the red gap ($78.37-&78.61) formed on Friday.
From today’s point of view, we see that the situation developed in accordance with the previous pro-increasing scenario, and the bulls reached the target mentioned in the quoted Oil Trading Alert.
How did the clash between the bulls and the red gap formed a week ago end?
Their complete success was because the resistance was broken, the gap was closed and the bears lost a valuable ally. This show of strength encouraged even more buyers to join the rally, which caused an increase to the next resistance area based on the bearish engulfing formation.
Despite this improvement and earlier successes, the bears woke up the next day in a fighting mood and decided to oppose the pressure of buyers. As a result, light crude opened Wednesday’s session with a red gap ($78.87-$78.48), which despite another bull attack (and the formation of a new local high) remains open and still serves as resistance.
Looking at yesterday’s session from today’s point of view, we can get the impression that Thursday’s session was nothing more than a repeat of what we saw the day before: opening of the day with a red gap ($78.54-$78.20), another unsuccessful attempt to neutralize the bearish engulfing formation, pullback and an extended upper shadow confirming the bears’ involvement in the area of the daily high.
Additionally, when we take a closer look at the chart (given all the very short-term changes on the chart – especially the new local high), we see that the bears gained another ally – the upper border of the blue rising channel, which currently intersects the nearest resistance area (based on the bearish engulfing pattern and medium-term resistances) and reinforces it.
What Does it Mean for the Price?
In my opinion, this tells us one thing very clearly: as long as the resistance zone described blocks the way to the north, further price increases are quite unlikely, and a reversal may be just around the corner (even if the bulls try to close the gaps and break above the channel once again during today’s session).
Summing up, crude oil tested the nearest important resistance zone in recent days, but the bulls not only failed to break above it, but they also failed at lower levels, allowing the bears to gain two allies (two red price gaps that block the way to the north). In my opinion, their appearance increases the chances of a growth correction in the coming week.
Have a wonderful weekend and see you on Monday


