USD/JPY stuck inside a key range
USD/JPY
+0.09%
Add to/Remove from Watchlist
Add to Watchlist
Add Position
Position added successfully to:
Please name your holdings portfolio
Type:
BUY
SELL
Date:
Amount:
Price
Point Value:
Leverage:
1:1
1:10
1:25
1:50
1:100
1:200
1:400
1:500
1:1000
Commission:
Create New Watchlist
Create
Create a new holdings portfolio
Add
Create
+ Add another position
Close
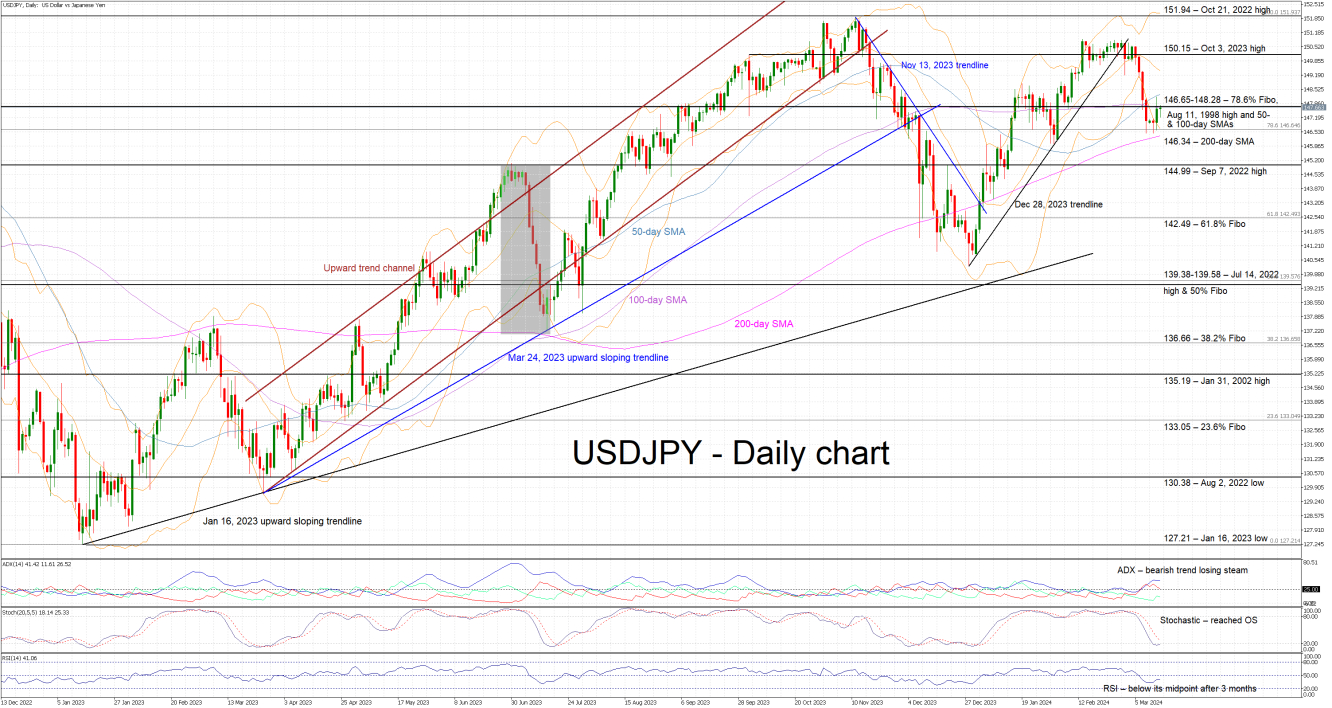
- USD/JPY trades sideways in anticipation of next week’s key events
- USD/JPY’s correction halted a tad above the 200-day SMA
- Momentum indicators support the bearish trend but with less conviction
 USDJPY_2024Mar13
USD/JPY is trying to record a green candle today as it tests the resistance set by the 146.65-148.28 range. The correction from the late February highs halted at the 200-day simple moving average (SMA) with market participants potentially positioning for the key events ahead, which include wage talk results and next week’s central bank meetings.
In the meantime, the momentum indicators remain mostly supportive of the recent correction. More specifically, the Average Directional Movement Index (ADX) is trading sideways, above the 25 threshold, and thus signalling a weakening bearish trend in USD/JPY. Similarly, the RSI has dropped below its 50-midpoint for the first time in more than 3 months, but it appears unable to record a lower low. More importantly, the stochastic oscillator has reached its oversold (OS) territory and maintains a good gap from its moving average.
Should the bulls regain confidence, they could try to lead USD/JPY above the 146.65-148.28 range and towards the October 3, 2023 high at 150.15. If successful, they could then stage a rally towards the October 21, 2022 high at 151.94 and gradually open the door to a new 30-year high.
On the flip side, the bears are keen to retake market control and finally break below the 146.65-148.28 area, which is populated by the 78.6% Fibonacci retracement of the October 21, 2022 – January 16, 2023 downtrend, the August 11, 1998 high, and the 50- and 100-day simple moving averages (SMAs). Even lower, the bears could push USD/JPY towards the September 7, 2022 high at 144.99 level, provided they manage to overcome the support set by the 200-day SMA at 146.34.
To sum up, USD/JPY bulls are attempting to recover part of their recent losses with the market’s attention firmly on the next key market events.


