BTC/USD
-3.90%
Add to/Remove from Watchlist
Add to Watchlist
Add Position
Position added successfully to:
Please name your holdings portfolio
Type:
BUY
SELL
Date:
Amount:
Price
Point Value:
Leverage:
1:1
1:10
1:25
1:50
1:100
1:200
1:400
1:500
1:1000
Commission:
Create New Watchlist
Create
Create a new holdings portfolio
Add
Create
+ Add another position
Close
-
Bitcoin faced intense selling pressure yesterday, with a nearly 10% drop amid record-high prices, reflecting growing apprehension in the market.
-
Despite Bitcoin’s recent bullish run, heightened market volatility has kept short-term investors on edge, exacerbated by the release of US inflation data this week.
-
The surge in US inflation figures, coupled with the unexpected rise in producer prices, added to the selling pressure on Bitcoin, sparking concerns about the impact of Fed policy on cryptocurrency markets.
-
Invest like the big funds for less than $9 a month with our AI-powered ProPicks stock selection tool. Learn more here>>
Yesterday, sellers took charge in the Bitcoin market, causing a nearly 10% drop in the first half of the day. Throughout last week, each time Bitcoin reached a new peak, it faced significant selling. Yesterday, it hit a new record high at $73,777, but this time, the selling pressure was even stronger.
Although the world’s largest cryptocurrency has been on a rapid upward trend in 2024 with minimal corrections, short-term cryptocurrency investors have been feeling the pressure daily. This week, the release of US inflation data provided an excuse for the decline.
Despite continued high demand for Bitcoin ETFs, the US CPI remained above expectations in February, causing tension in the market. Additionally, yesterday’s release of the US PPI added to the selling pressure as it also exceeded expectations.
Even if the Fed does not raise interest rates to combat inflation, it may keep them high for an extended period, affecting costs in the market. Furthermore, high dollar yields could negatively impact risky markets, causing cryptocurrencies to react downward to inflation data supporting the Fed’s hawkish stance.
Bitcoin Key Trading Levels
Looking at Bitcoin’s current situation, selling intensified yesterday as the cryptocurrency’s price closed below the midline of the rising channel it had been following in March.
In terms of short-term support levels, $68,240 is seen as the nearest support level, followed by $65,150. It’s worth noting that the selling pressure in the first half of the day also reached the bottom line of the channel.
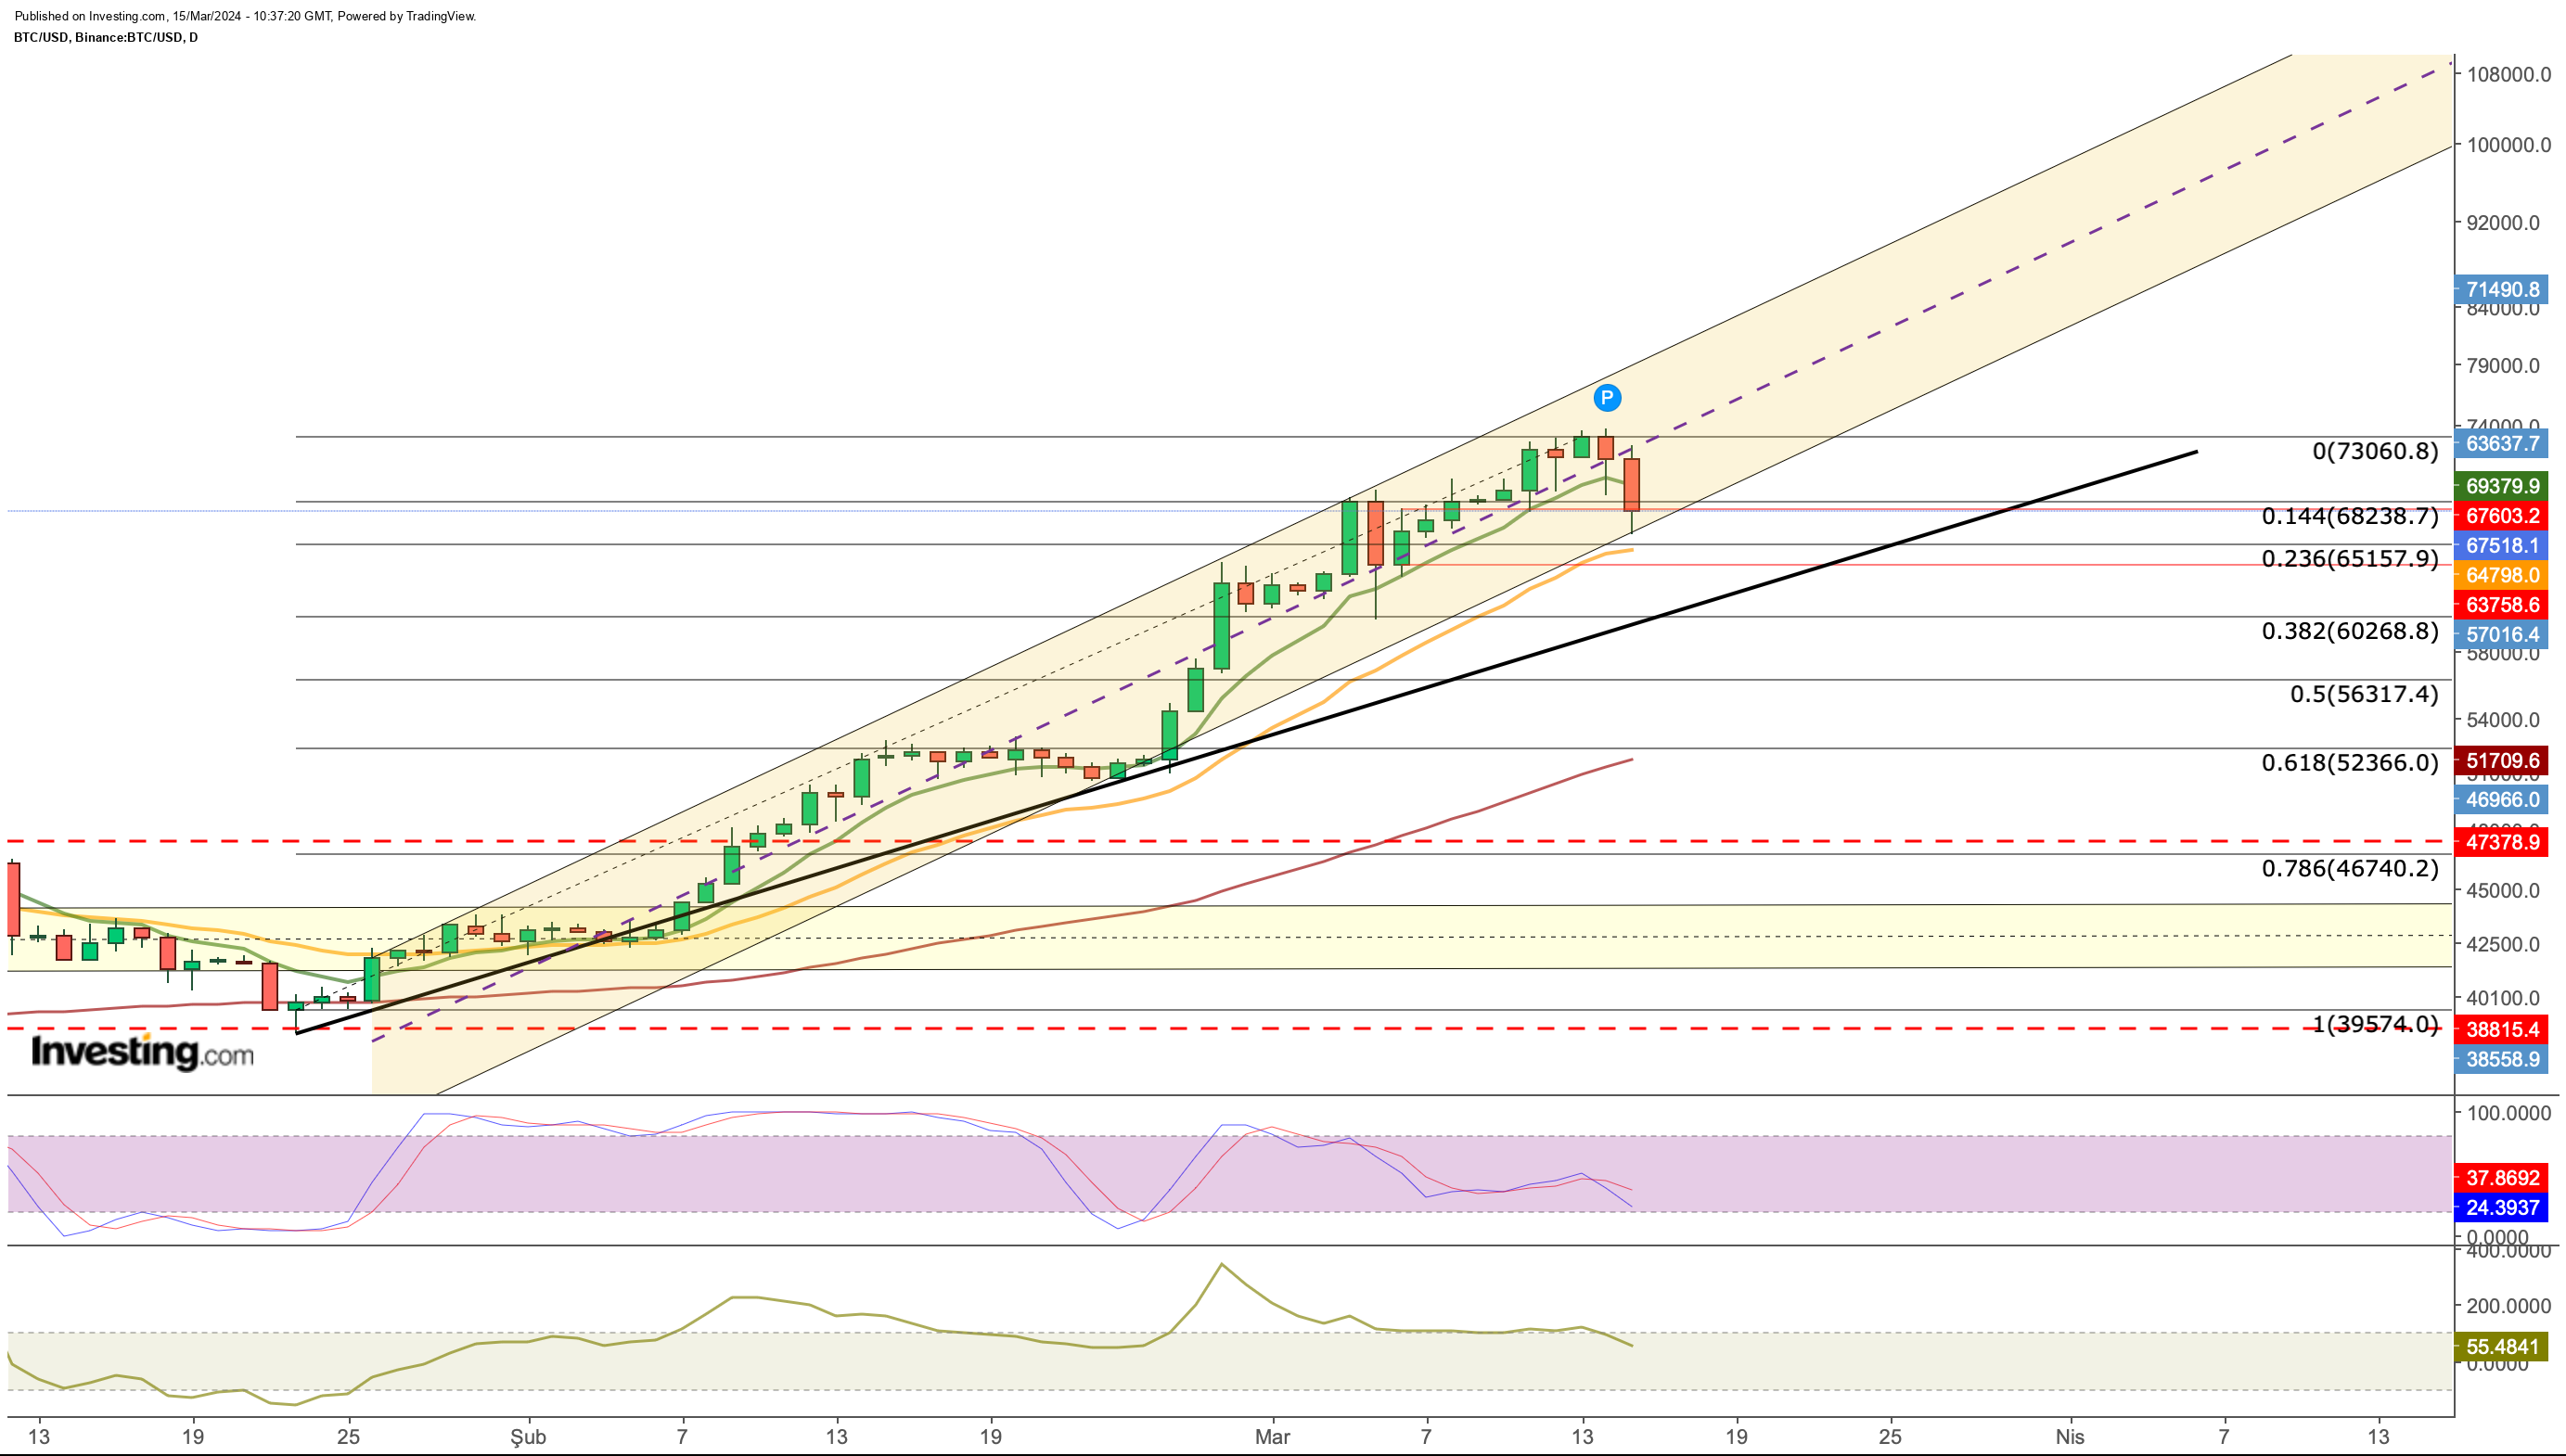

If the support line breaks, Bitcoin may drop towards Fib 0.382. Additionally, if it falls below $65,000 and breaches the short-term uptrend line, the next support level around $60,000 may come into play. A further drop could lead to a correction, possibly down to the $50,000 – $52,000 range.
However, if Bitcoin maintains its position within the rising channel, it could continue its upward trajectory in 2024. Keeping an eye on hourly closures above $68,250 is crucial for potential recovery. Reaching back to $73,000 could signal a strengthening trend, possibly pushing Bitcoin to its next peak around $82,000.
***
Check out InvestingPro to stay in sync with the market trend and what it means for your trading. As with any investment, it’s crucial to research extensively before making any decisions.
InvestingPro empowers investors to make informed decisions by providing a comprehensive analysis of undervalued stocks with the potential for significant upside in the market.
Subscribe here for under $9/month and never miss a bull market again!


Disclaimer: