Bitcoin Rally Tests Old High; Will Fibonacci Price Resistance Hold Again?
BTC/USD
+5.39%
Add to/Remove from Watchlist
Add to Watchlist
Add Position
Position added successfully to:
Please name your holdings portfolio
Type:
BUY
SELL
Date:
Amount:
Price
Point Value:
Leverage:
1:1
1:10
1:25
1:50
1:100
1:200
1:400
1:500
1:1000
Commission:
Create New Watchlist
Create
Create a new holdings portfolio
Add
Create
+ Add another position
Close
Bitcoin has been all the rage in the financial markets lately. After it surpassed 50000, headline after headline has come out about it making new all-time highs.
Well it finally happened. And Bitcoin’s price has retreated a little since.
 BTC Monthly Chart
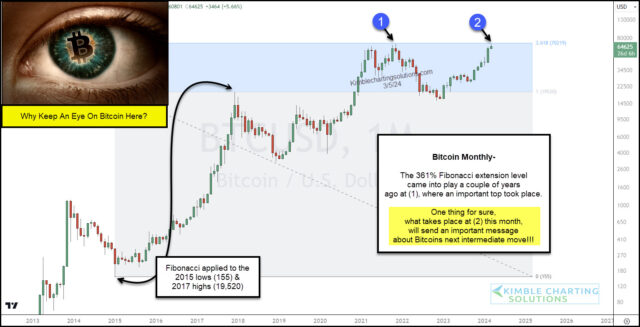
As you can see on today’s “monthly” chart, Bitcoin is basically trading at the highs that formed two years ago – see points (1) and (2). But, more importantly, Bitcoin is trading at its 161% Fibonacci price extension level. This resistance level stopped the last rally at (1)… will it stop (or stall) this rally at (2)?
One thing is for sure: What happens next at (2) is worth keeping a close eye on!!!


