Crude Oil: Can It Overcome Upcoming Resistances?
CL
-1.86%
Add to/Remove from Watchlist
Add to Watchlist
Add Position
Position added successfully to:
Please name your holdings portfolio
Type:
BUY
SELL
Date:
Amount:
Price
Point Value:
Leverage:
1:1
1:10
1:25
1:50
1:100
1:200
1:400
1:500
1:1000
Commission:
Create New Watchlist
Create
Create a new holdings portfolio
Add
Create
+ Add another position
Close
On Tuesday, crude oil extended gains, but are the bulls strong enough to test higher levels?
Technical Picture of Crude Oil
 Will Crude Oil Meet Next Resistances? – Image 1
 Will Crude Oil Meet Next Resistances? – Image 2
Let’s start today’s analysis with the quotes from yesterday’s Oil Trading Alert:
From today’s point of view, we see that the bulls broke through the first resistance without any problem and moved northwards in the following hours. Thanks to their march, the price increased to an intraday high of $83.12 but then pulled back a bit and finished the day under the level of $83.
What paused the bulls?
The answer to this question can be found on the chart below.
 Price Chart
From this perspective, we see that crude oil climbed to the upper line of the very short-term purple rising wedge, which woke up the bears and encouraged them to act – not only before yesterday’s session closure but also earlier today.
Let’s take a closer look at the 4-hour chart below.
 Will Crude Oil Meet Next Resistances? – Image 4
On the above chart, we see that the commodity extended losses and slipped to the first Fibonacci retracement based on the entire recent upward move.
What’s next?
If this support withstands the selling pressure, we’ll likely see a reversal and a re-test of yesterday’s high and the upper line of the purple rising wedge or even an upswing to a fresh peak and a test of the upper border of the green trend channel.
At this point, it is worth noting that not far from this resistance, the size of the upward move would be equal to the height of the black declining channel (marked on the third chart), which in combination with the proximity to the 161.8% Fibonacci extension (based on the March decline and marked on the 4-hour chart), the upper border of the green channel and the bearish engulfing candlestick pattern (marked on the second chart) could encourage oil bears to show their claws and trigger a bigger move to the downside – especially if the daily indicators generate sell signals.
The pro-bullish scenario is currently supported by yesterday’s volume, which visibly increased once again, confirming oil bulls’ involvement and suggesting that one more upswing (to the mentioned resistances) is likely.
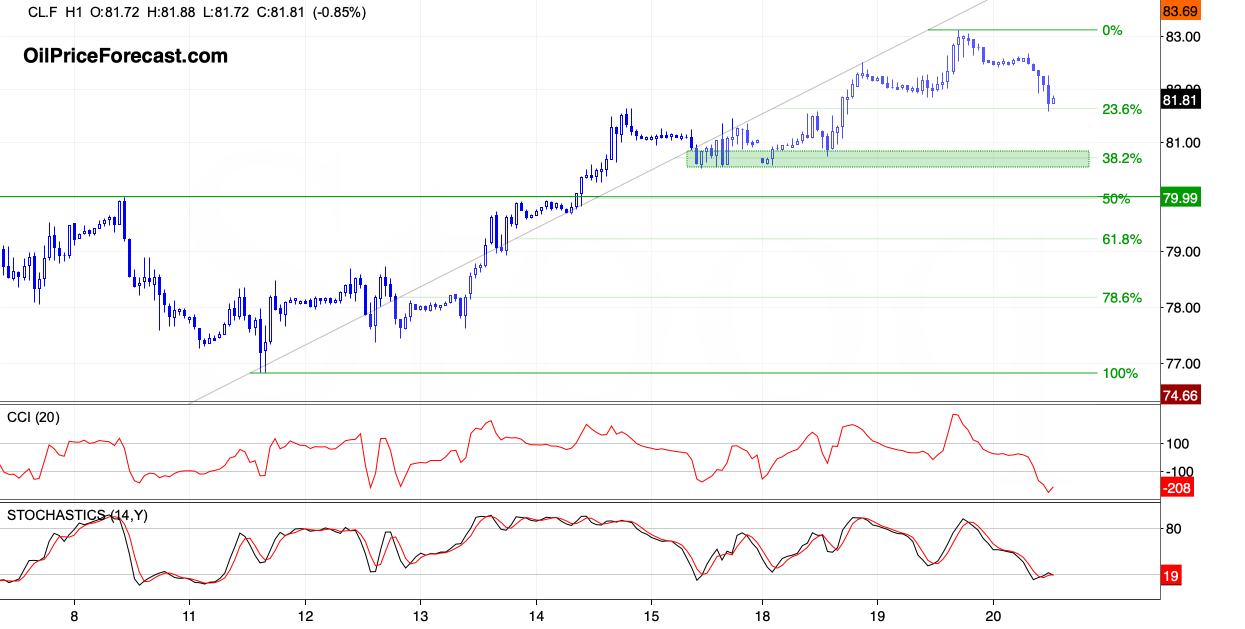
Additionally, when we take a closer look at the 1-hour chart below, we notice that the CCI and the Stochastic Oscillator slipped to their oversold areas (actually to the lowest levels since Friday), which suggests that we’ll likely see buy signals in the very near future, which could translate into a rebound later in the day.
 Will Crude Oil Meet Next Resistances? – Image 5
What could happen if the bulls fail?
We’ll likely see a test of the green support zone created by the 38.2% Fibonacci retracement based on the recent entire upward move and the previously broken early-Mar. peak. However, if the bears manage to invalidate the earlier breakout above the March high, we could also see a test of the barrier of $80.
Summing up, crude oil extended gains, but pulled back before the end of the day as the nearest resistance line encouraged the sellers to act. Earlier today, the bears pushed the commodity even lower, but taking into account the first Fibonacci support, the current position of the indicators (seen on the 1-hour chart) and yesterday’s volume (which increased once again), it seems that one more upswing and a test of the upper border of the short-term rising trend channel may be just around the corner.


