Gold Breaks Out of Cup and Handle With Eyes on All-Time Highs
XAU/USD
+0.75%
Add to/Remove from Watchlist
Add to Watchlist
Add Position
Position added successfully to:
Please name your holdings portfolio
Type:
BUY
SELL
Date:
Amount:
Price
Point Value:
Leverage:
1:1
1:10
1:25
1:50
1:100
1:200
1:400
1:500
1:1000
Commission:
Create New Watchlist
Create
Create a new holdings portfolio
Add
Create
+ Add another position
Close
Gold
+0.58%
Add to/Remove from Watchlist
Add to Watchlist
Add Position
Position added successfully to:
Please name your holdings portfolio
Type:
BUY
SELL
Date:
Amount:
Price
Point Value:
Leverage:
1:1
1:10
1:25
1:50
1:100
1:200
1:400
1:500
1:1000
Commission:
Create New Watchlist
Create
Create a new holdings portfolio
Add
Create
+ Add another position
Close
I have written about Gold’s super bullish Cup & Handle Pattern multiple times over the last few years.
Yesterday, Gold finally broke out from the handle and surged above $2100 to $2126. Gold had already made all-time high closes in quarterly, monthly, and weekly terms, but clearing $2100 made it official.
Depending on how you measure, the upside target is $2,920 or $3,090. The log target, which I have discussed in past articles, is roughly $4,000.
Those targets are nice, but Gold is lifting away from a 13-year base.
At worst, it is the most significant breakout since 2005, after which Gold surged 360% in the next six years.
At best, it is the most significant breakout since 1971, when the United States abandoned the Gold Standard. Gold Price Chart
Let’s step back and retreat to the near-term to medium-term outlook.
Two smaller cup and handle patterns formed within the giant handle on the 13-year cup and handle pattern.
The most recent cup and handle pattern projects to $2350, and that cup is the handle on a larger cup and handle pattern that formed over the last two years. That cup and handle pattern projects to $2500. 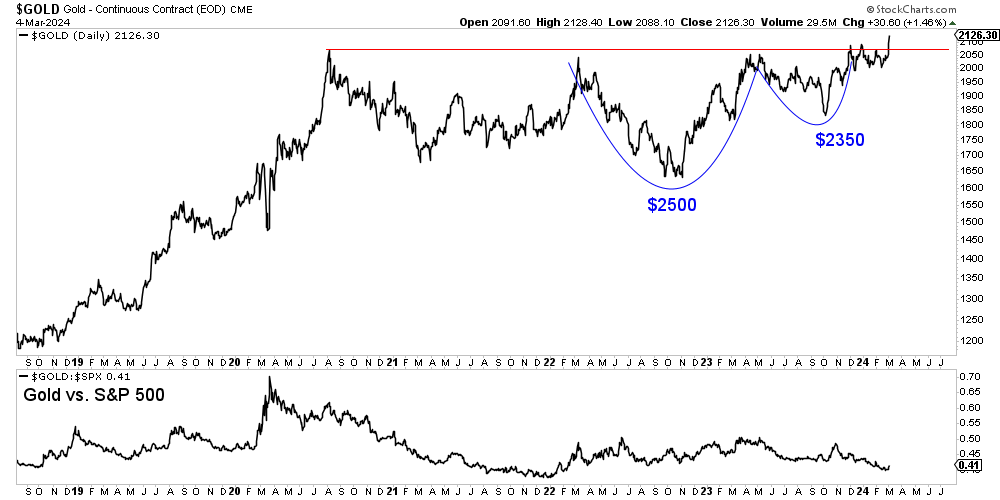 Gold vs S&P 500-Daily Chart
This is an incredibly bullish technical setup for Gold, but we must watch how Gold performs against the stock market.
If this is a melt-up in which Gold does not outperform the stock market and merely rises with it, then it could be susceptible to a snapback to previous resistance.
However, if Gold confirms this breakout by dramatic outperformance in real terms, then little can stop it.
Either way, Gold should be able to reach $2500 in the medium term.
In our last article, we noted the potential of gold stocks if Gold could move to $2400-$2500. We may not see the vertical rebound we had in late 2008, early 2016, and spring 2020, but we should see some dramatic gains.
The opportunity is finding the companies that can create value at present metal prices, which are priced too cheaply.


