Gold Reaches New Peak Amid Favorable Conditions: What’s Next?
XAU/USD
+0.76%
Add to/Remove from Watchlist
Add to Watchlist
Add Position
Position added successfully to:
Please name your holdings portfolio
Type:
BUY
SELL
Date:
Amount:
Price
Point Value:
Leverage:
1:1
1:10
1:25
1:50
1:100
1:200
1:400
1:500
1:1000
Commission:
Create New Watchlist
Create
Create a new holdings portfolio
Add
Create
+ Add another position
Close
Gold
+0.59%
Add to/Remove from Watchlist
Add to Watchlist
Add Position
Position added successfully to:
Please name your holdings portfolio
Type:
BUY
SELL
Date:
Amount:
Price
Point Value:
Leverage:
1:1
1:10
1:25
1:50
1:100
1:200
1:400
1:500
1:1000
Commission:
Create New Watchlist
Create
Create a new holdings portfolio
Add
Create
+ Add another position
Close
Gold’s price momentum continues, with a Troy ounce of the precious metal touching a new record high, standing close to $2115.00 as of Tuesday. The surge in gold prices can be attributed to a confluence of factors that favor its ascent.
Key drivers behind the rally include the diminishing yields on US government bonds and a softening in the stance of the US dollar. Moreover, there’s growing anticipation in the markets regarding the Federal Reserve’s expected transition towards a more accommodative monetary policy stance. Such conditions are traditionally beneficial for gold, as it often inversely correlates with the performance of the US dollar.
Additionally, robust physical demand from global central banks has played a significant role in underpinning gold’s price surge, indicating a strong confidence in the metal as a reserve asset.
Technical Analysis of XAU/USD XAU/USD analysis
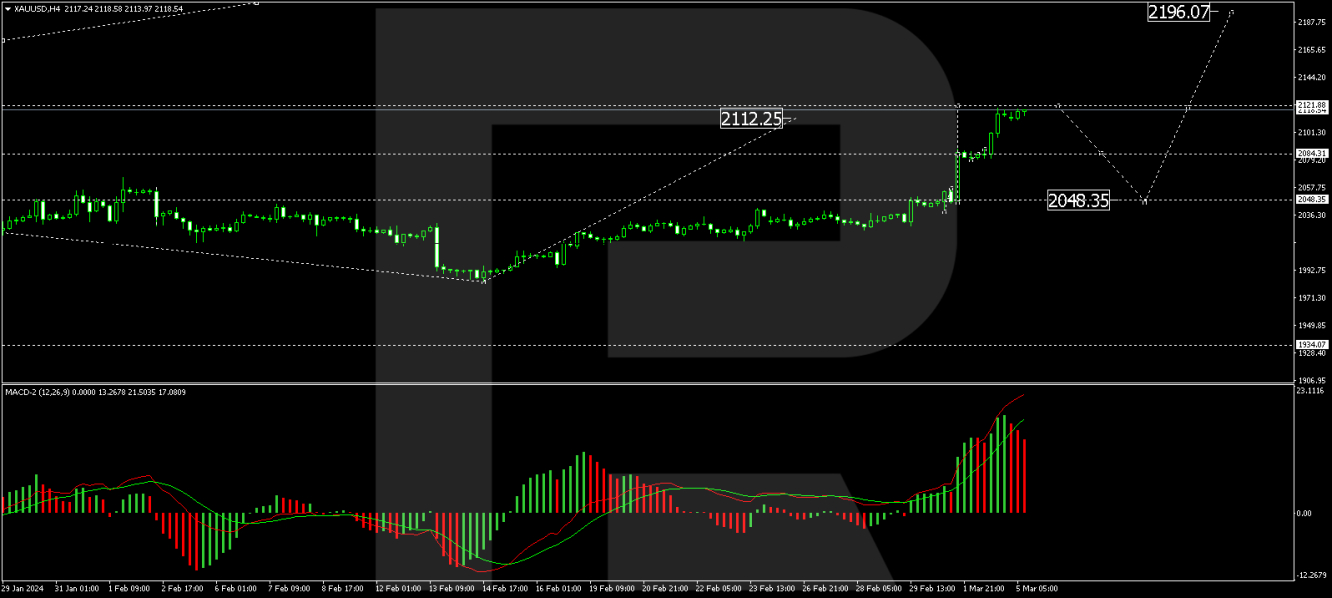
The H4 chart analysis for XAU/USD reveals the formation of a consolidation range around the 2048.35 level. A break above this range could signal the continuation of the upward trend, potentially reaching 2121.21. Upon achieving this milestone, a correction back towards 2048.35 may occur, setting the stage for a further rise to 2196.07, which is identified as a local target. The MACD indicator corroborates this bullish scenario, with its signal line positioned above zero and indicating a strong upward momentum.
 XAU/USD analysis
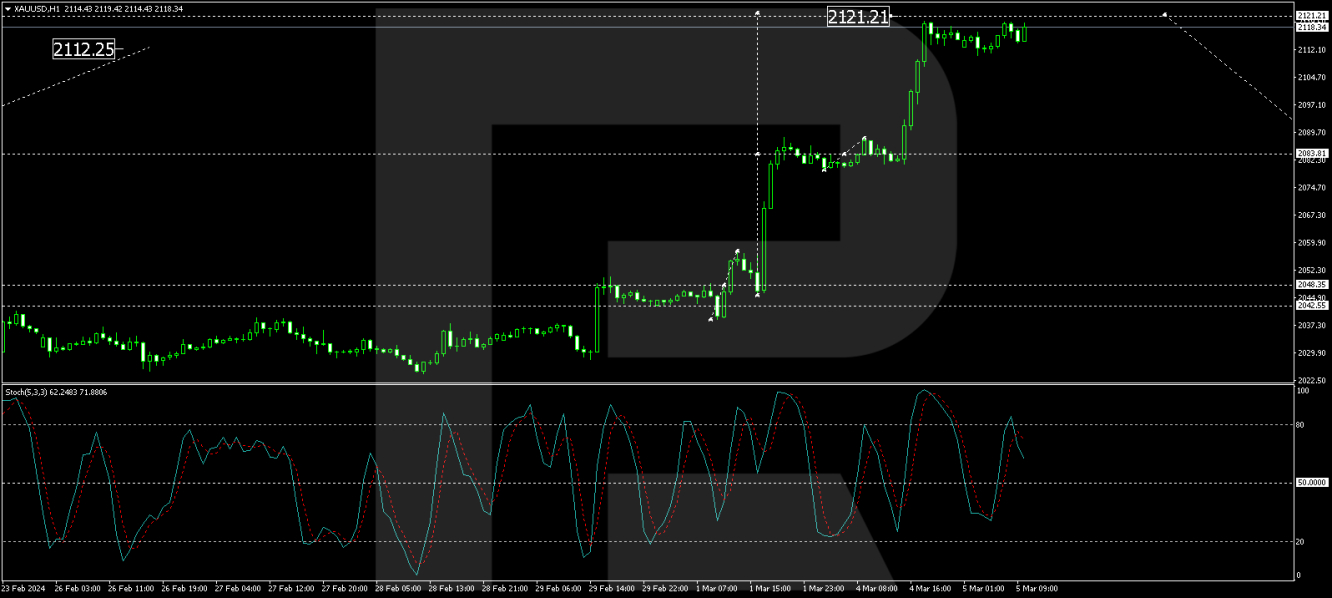
On the H1 chart, the price has established a consolidation range near 2083.83. An upward breakout from this consolidation could lead to a climb towards 2121.21. Subsequently, a correction to 2083.81 may take place, marking the initial target of this correction phase. This technical outlook is supported by the Stochastic oscillator, which, despite being below the 80 mark, is poised for a downward movement towards 20, suggesting potential fluctuations within the ongoing bullish trend.
By RoboForex Analytical Department
Disclaimer


