Gold: Not Yet Overheated, Primed for a Huge Move Higher
XAU/USD
+0.71%
Add to/Remove from Watchlist
Add to Watchlist
Add Position
Position added successfully to:
Please name your holdings portfolio
Type:
BUY
SELL
Date:
Amount:
Price
Point Value:
Leverage:
1:1
1:10
1:25
1:50
1:100
1:200
1:400
1:500
1:1000
Commission:
Create New Watchlist
Create
Create a new holdings portfolio
Add
Create
+ Add another position
Close
Gold
+0.53%
Add to/Remove from Watchlist
Add to Watchlist
Add Position
Position added successfully to:
Please name your holdings portfolio
Type:
BUY
SELL
Date:
Amount:
Price
Point Value:
Leverage:
1:1
1:10
1:25
1:50
1:100
1:200
1:400
1:500
1:1000
Commission:
Create New Watchlist
Create
Create a new holdings portfolio
Add
Create
+ Add another position
Close
Gold is primed for a substantial move, second only to cryptocurrencies in amplitude but lacking their enduring strength. At the end of last week, we saw a swift technical completion of a bullish pattern.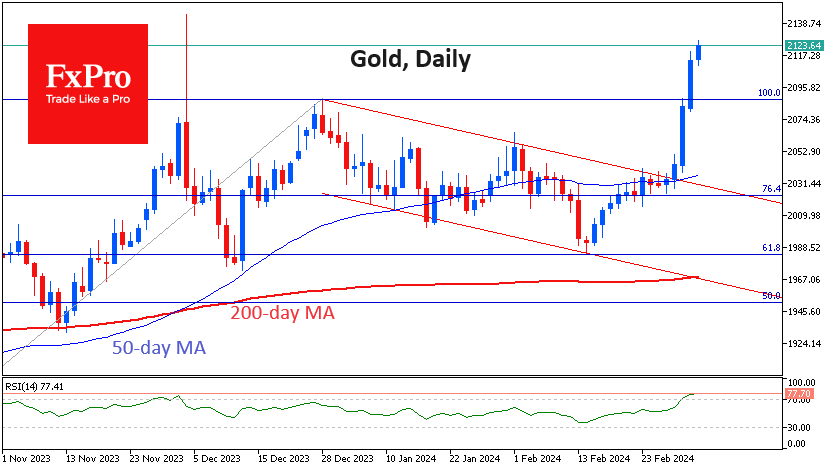 Gold-Daily Chart
Sometimes, gold avoids volatility for weeks, but at certain moments, strong multi-day trends are born, and the movement becomes almost one-sided, as we saw this time.
After breaking through the resistance of the descending channel, gold quickly moved higher, gaining almost 2% on Friday, another 1.5% on Monday and over 0.5% since the start of the day on Tuesday. Current levels at $2126 are around all-time highs. The higher price was off-market at the start of trading on the 1st, with a history-making short squeeze of 3.5%.
After Monday’s strong rally above $2088, which rewrote the closing highs, the current working scenario for gold is for a rally to the $2255 area, which is the 161.8% level from the initial October-December impulse. The price has made a classic corrective pullback to 61.8% of the initial rally at the start of the year.  Gold-Weekly Chart
One of the warning signs is the overbought RSI. At 77.7, the Relative Strength Index is at its highest level since March 2022, where it remained for the following 14 months.
The RSI reached even higher levels in July-August 2020, and we see more similarities with this particular episode. The overbought RSI then, as it is now, coincided with the entry into the historical high area above $1800. Technically, it wasn’t an all-time high, as it is the case now, but it was a move out of a steadily traded range (then $1800, now $2050), and that is what matters.


