Long Bonds Are at a Tipping Point Ahead of Key Central Bank Decision
TLT
+0.28%
Add to/Remove from Watchlist
Add to Watchlist
Add Position
Position added successfully to:
Please name your holdings portfolio
Type:
BUY
SELL
Date:
Amount:
Price
Point Value:
Leverage:
1:1
1:10
1:25
1:50
1:100
1:200
1:400
1:500
1:1000
Commission:
Create New Watchlist
Create
Create a new holdings portfolio
Add
Create
+ Add another position
Close
XAU/USD
-0.20%
Add to/Remove from Watchlist
Add to Watchlist
Add Position
Position added successfully to:
Please name your holdings portfolio
Type:
BUY
SELL
Date:
Amount:
Price
Point Value:
Leverage:
1:1
1:10
1:25
1:50
1:100
1:200
1:400
1:500
1:1000
Commission:
Create New Watchlist
Create
Create a new holdings portfolio
Add
Create
+ Add another position
Close
US500
+0.56%
Add to/Remove from Watchlist
Add to Watchlist
Add Position
Position added successfully to:
Please name your holdings portfolio
Type:
BUY
SELL
Date:
Amount:
Price
Point Value:
Leverage:
1:1
1:10
1:25
1:50
1:100
1:200
1:400
1:500
1:1000
Commission:
Create New Watchlist
Create
Create a new holdings portfolio
Add
Create
+ Add another position
Close
US2000
+0.54%
Add to/Remove from Watchlist
Add to Watchlist
Add Position
Position added successfully to:
Please name your holdings portfolio
Type:
BUY
SELL
Date:
Amount:
Price
Point Value:
Leverage:
1:1
1:10
1:25
1:50
1:100
1:200
1:400
1:500
1:1000
Commission:
Create New Watchlist
Create
Create a new holdings portfolio
Add
Create
+ Add another position
Close
SPY
+0.57%
Add to/Remove from Watchlist
Add to Watchlist
Add Position
Position added successfully to:
Please name your holdings portfolio
Type:
BUY
SELL
Date:
Amount:
Price
Point Value:
Leverage:
1:1
1:10
1:25
1:50
1:100
1:200
1:400
1:500
1:1000
Commission:
Create New Watchlist
Create
Create a new holdings portfolio
Add
Create
+ Add another position
Close
Gold
-0.17%
Add to/Remove from Watchlist
Add to Watchlist
Add Position
Position added successfully to:
Please name your holdings portfolio
Type:
BUY
SELL
Date:
Amount:
Price
Point Value:
Leverage:
1:1
1:10
1:25
1:50
1:100
1:200
1:400
1:500
1:1000
Commission:
Create New Watchlist
Create
Create a new holdings portfolio
Add
Create
+ Add another position
Close
Most investors consider the level of interest rates to be the source of the “tipping points” that move stocks. TLT Price Chart
We’ve found that the velocity of interest rate changes is equally as reliable as absolute levels at identifying “tipping point” effects on other markets and trends such as stocks, gold, housing, currencies, the economy, etc.”
My colleague Geoff points out:
“A move over 100 in TLT could lead to a surprisingly big move higher in bonds, and LOWER in interest rates.”
And that…” a pattern as coiled as this one has the potential to be equally as volatile if it “fails” or breaks down.”
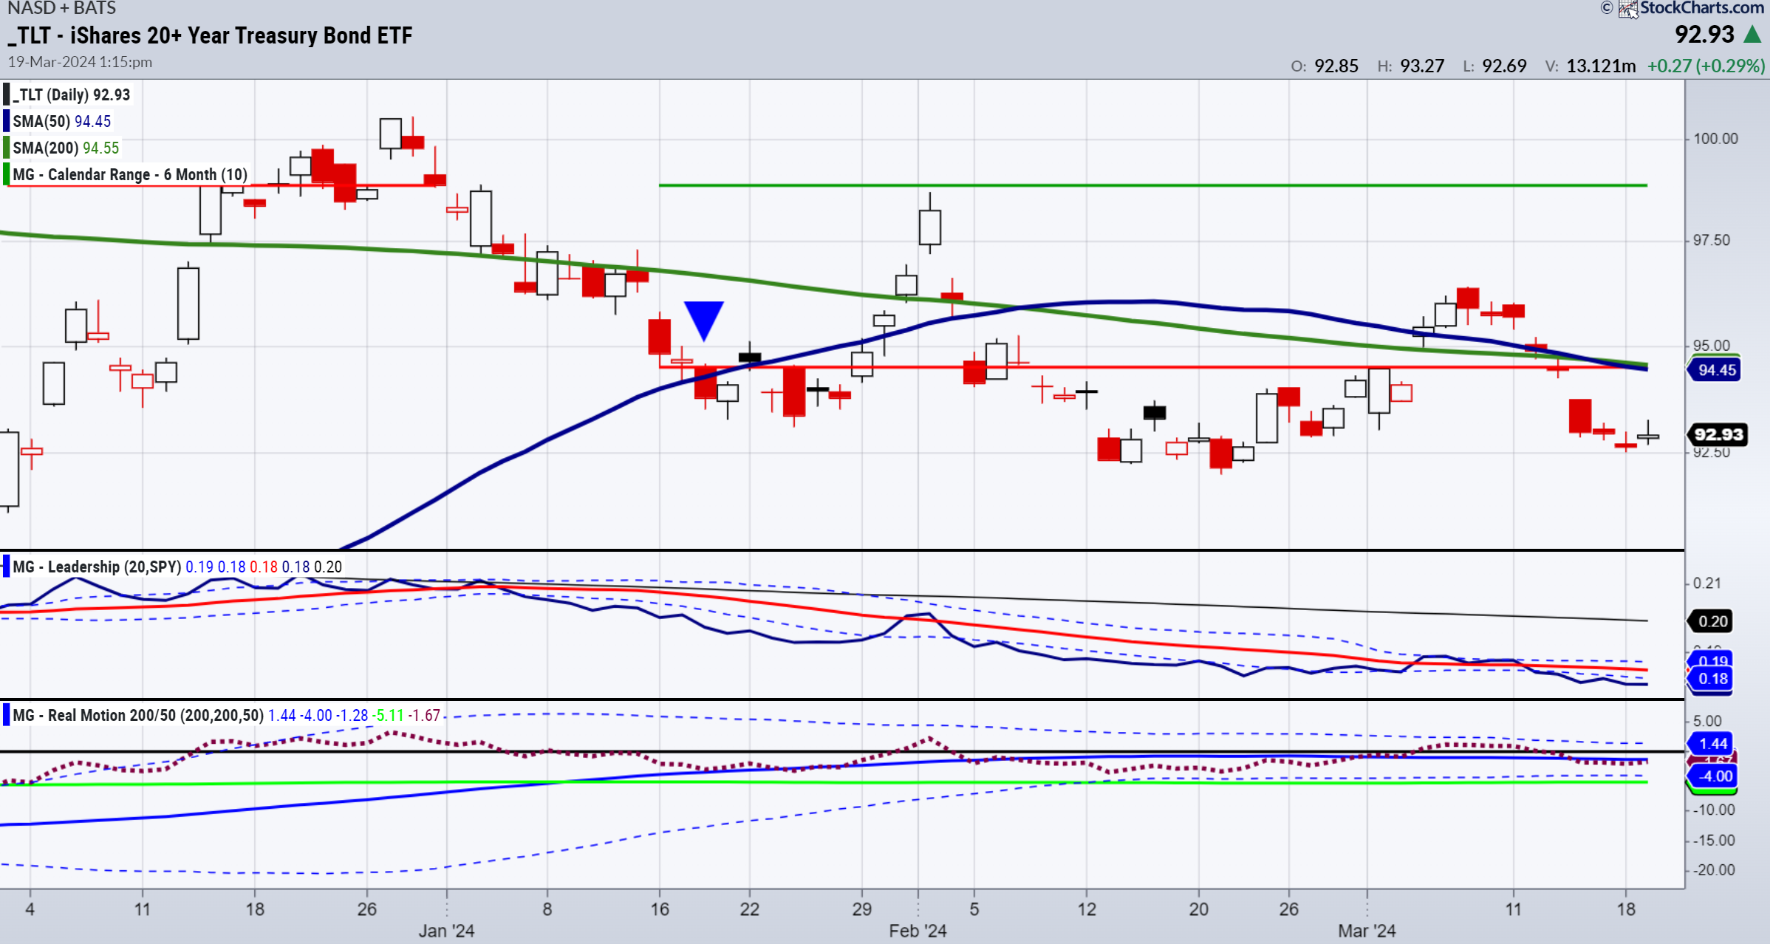
Looking at the Daily chart of iShares 20+ Year Treasury Bond ETF (NASDAQ:TLT), support at around $92 has held up.
While the price moving averages signify a death cross (bear phase), the momentum indicators in Real Motion show a caution phase.
Furthermore, TLT underperforms SPDR® S&P 500 (NYSE:SPY), which we consider a risk-on factor.
 SPY Vs. TLT Chart
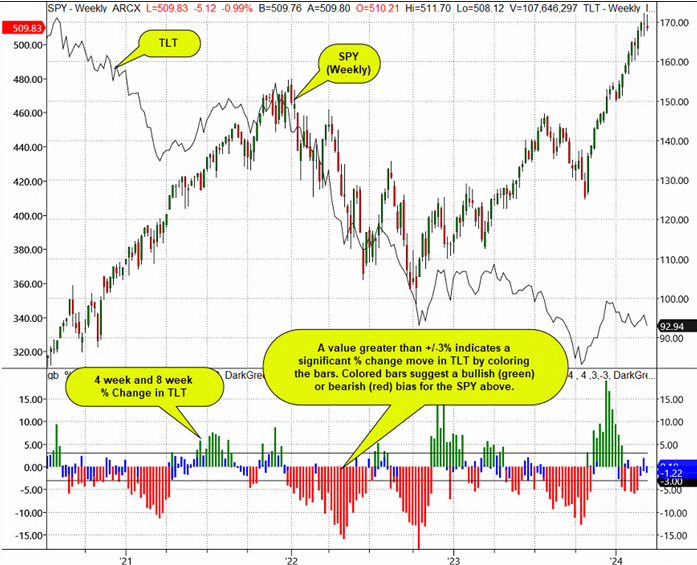
In this chart, Geoff shows you an indicator that helps us anticipate the direction of the stock market based on the bond market.
This proprietary indicator is “intended to tell you when the stock market will likely react to the bond market in a meaningful way.”
If the histogram is red, interest rates are moving up (bonds, TLT, moving down) at a pace that is too fast and bearish for stocks.
If the histogram is green, then TLT is moving up (rates are going lower) at a pace that can be considered bullish for stocks.
Currently, the histogram is neutral.
Classically, we would expect stocks to fall if the bonds yields rise and TLT breaks 92.00.
The interesting part of this equation for us though, is how commodities factor in.
One would assume stocks will rise if yields fall and TLT rallies.
But what about the bullish trend that is in place for many commodity futures?
Yields fall too fast, and commodities will scream higher.
While stocks will like lower yields too, we are cautious about any substantial rise in inflation.
On the flip side, should yields rise, stocks will fall.
However, if commodities have legs based on supply and demand, they may not fall at all.
This is why we say long bonds are at a tipping point.
ETF Summary
- S&P 500 (SPY) 510 pivotal
- Russell 2000 (IWM) 202 if holds good sign
- Dow (DIA) 385 support 400 resistance
- Nasdaq (QQQ) 428 the 50-DMA support
- Regional banks (KRE) 45-50 range
- Semiconductors (SMH) 214 support 224 resistance to clear
- Transportation (IYT) 68 area support
- Biotechnology (IBB) 140-142 resistance 135 support
- Retail (XRT) 73 support 77 resistance
- iShares iBoxx Hi Yd Cor Bond ETF (HYG) 77 big number to hold. Over 78 risk ON


