US500
+0.63%
Add to/Remove from Watchlist
Add to Watchlist
Add Position
Position added successfully to:
Please name your holdings portfolio
Type:
BUY
SELL
Date:
Amount:
Price
Point Value:
Leverage:
1:1
1:10
1:25
1:50
1:100
1:200
1:400
1:500
1:1000
Commission:
Create New Watchlist
Create
Create a new holdings portfolio
Add
Create
+ Add another position
Close
US2000
-0.72%
Add to/Remove from Watchlist
Add to Watchlist
Add Position
Position added successfully to:
Please name your holdings portfolio
Type:
BUY
SELL
Date:
Amount:
Price
Point Value:
Leverage:
1:1
1:10
1:25
1:50
1:100
1:200
1:400
1:500
1:1000
Commission:
Create New Watchlist
Create
Create a new holdings portfolio
Add
Create
+ Add another position
Close
IWM
-0.57%
Add to/Remove from Watchlist
Add to Watchlist
Add Position
Position added successfully to:
Please name your holdings portfolio
Type:
BUY
SELL
Date:
Amount:
Price
Point Value:
Leverage:
1:1
1:10
1:25
1:50
1:100
1:200
1:400
1:500
1:1000
Commission:
Create New Watchlist
Create
Create a new holdings portfolio
Add
Create
+ Add another position
Close
IXIC
+0.82%
Add to/Remove from Watchlist
Add to Watchlist
Add Position
Position added successfully to:
Please name your holdings portfolio
Type:
BUY
SELL
Date:
Amount:
Price
Point Value:
Leverage:
1:1
1:10
1:25
1:50
1:100
1:200
1:400
1:500
1:1000
Commission:
Create New Watchlist
Create
Create a new holdings portfolio
Add
Create
+ Add another position
Close
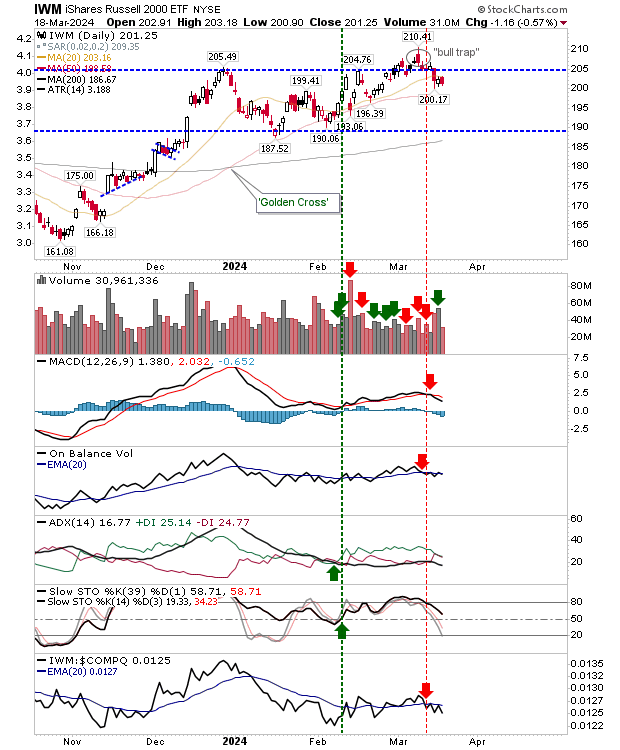
The Russell 2000 (IWM) has been defending its 50-day MA over the early part of 2024, but the last few days have seen a shift in this support with ‘sell’ triggers in the MACD and On-Balance-Volume.
The index is underperforming relative to the Nasdaq, but it has been a bit of a whipsaw scenario since early February.
Buyers need to dig in soon because a loss of next support at the 50-day MA spells trouble and opens up a test of the 200-day MA.

The Nasdaq closed with a bearish ‘black’ candlestick that failed to challenge the March high. There are ‘sell’ triggers in the MACD and On-Balance-Volume to work off, but yesterday’s finish suggests more downside today.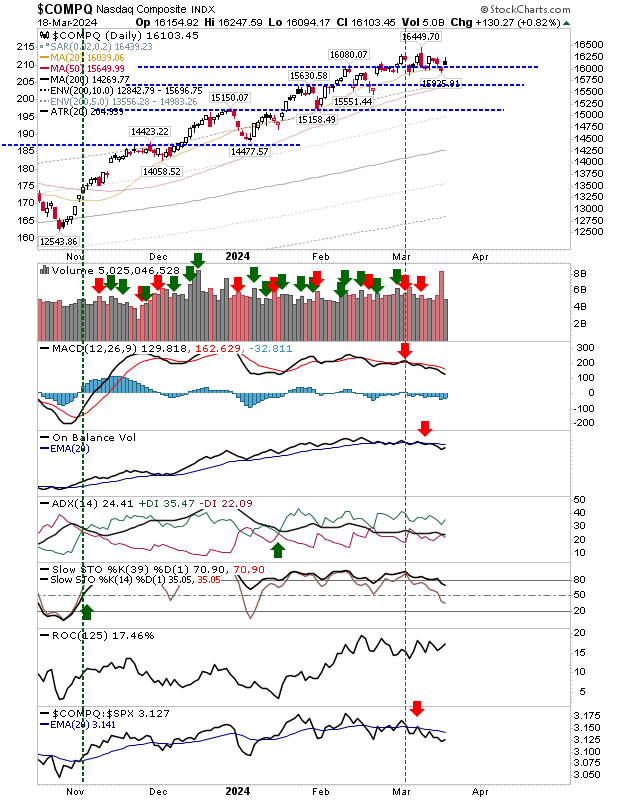

The S&P 500 closed with a doji that also failed to challenge all-time highs. As with the Nasdaq, there are ‘sell’ triggers in the MACD and On-Balance-Volume to overcome but it did retain breakout support and relative performance is improving.
Yesterday wasn’t quite the action I was looking for in the S&P 500 so caution remains advised as the outlook edges bearish.
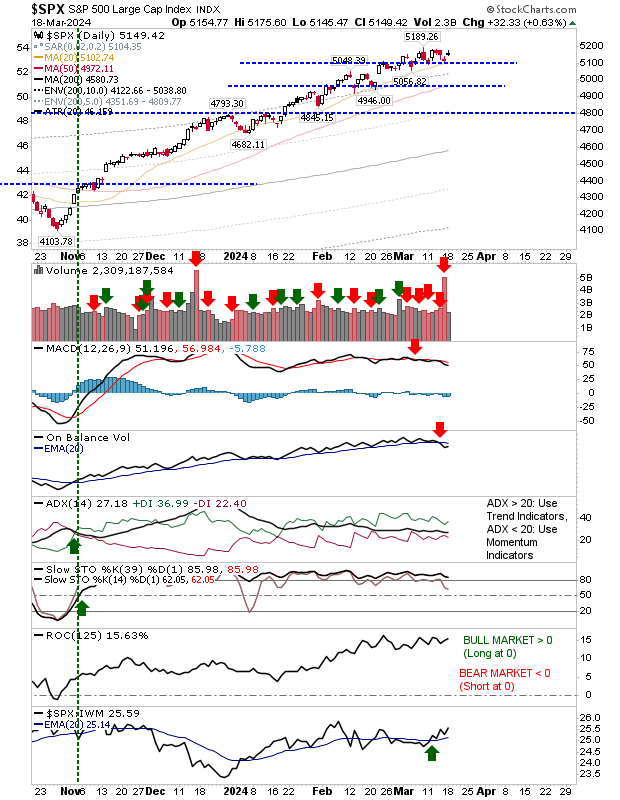
For today we will want to see a more bullish push in the S&P 500 that negates the bearishness of yesterday’s action and closes at new highs. This should help other indexes challenge their more bearish setups, although it likely won’t negate them.