Stock Market Retreats Amid Profit-Taking: Is There Potential for Further Downside?
ESH24
+0.59%
Add to/Remove from Watchlist
Add to Watchlist
Add Position
Position added successfully to:
Please name your holdings portfolio
Type:
BUY
SELL
Date:
Amount:
Price
Point Value:
Leverage:
1:1
1:10
1:25
1:50
1:100
1:200
1:400
1:500
1:1000
Commission:
Create New Watchlist
Create
Create a new holdings portfolio
Add
Create
+ Add another position
Close
NQH24
+0.91%
Add to/Remove from Watchlist
Add to Watchlist
Add Position
Position added successfully to:
Please name your holdings portfolio
Type:
BUY
SELL
Date:
Amount:
Price
Point Value:
Leverage:
1:1
1:10
1:25
1:50
1:100
1:200
1:400
1:500
1:1000
Commission:
Create New Watchlist
Create
Create a new holdings portfolio
Add
Create
+ Add another position
Close
1YMH24
+0.46%
Add to/Remove from Watchlist
Add to Watchlist
Add Position
Position added successfully to:
Please name your holdings portfolio
Type:
BUY
SELL
Date:
Amount:
Price
Point Value:
Leverage:
1:1
1:10
1:25
1:50
1:100
1:200
1:400
1:500
1:1000
Commission:
Create New Watchlist
Create
Create a new holdings portfolio
Add
Create
+ Add another position
Close
1. Emini S&P March futures collapsed quickly, all the way back towards Thursday’s low and strong support at 5060/55, with a low for the day 3 points above.
2. Nasdaq March futures collapsed to first support at 18000/17900 and longs need stops below 17800. (A low for the day at 17,832 keeps us in longs).
3. Emini Dow Jones March futures broke support at 39000/38900 and headed straight for the next downside target of 38550/500, with a low for the day almost exactly here. (Well done if you managed to reverse into a short to take advantage of this move).
Emini S&P: unexpectedly collapsed almost as far as strong support at 5060/55, without warning, although we are severely overbought of course. Longs need stops below 5045.
- This support is so important that a break lower today could even be seen as a short-term sell signal (despite the very strong longer-term bull trend) and we could fall as far as 5010/00 for profit taking on any shorts.
- A bounce from 5005/4995 would be expected but longs need stops below 4985.
- I wonder if we will build a short-term head and shoulders pattern. I am watching carefully.
- If we were to make a high for the day at strong resistance at 5115/25, this would increase the chances of this pattern forming, but shorts need stops above 5135.
Nasdaq March futures longs at first support at 18000/17900 need stops below 17800.
- Profit targets is in the 18130/170 area and a high for the day is certainly possible here.
- If you try a short at 18130/170, stop above 18220.
- THE BEST SUPPORT FOR THIS WEEK SHOULD BE AT 17760/730. As long as this holds, bulls remain fully in control, despite yesterday’s aggressive sell-off. Longs need stops below 17630.
A break lower should see 17730/760 act as resistance targeting 17550/520 and even as far as 17400/350 for profit taking on shorts.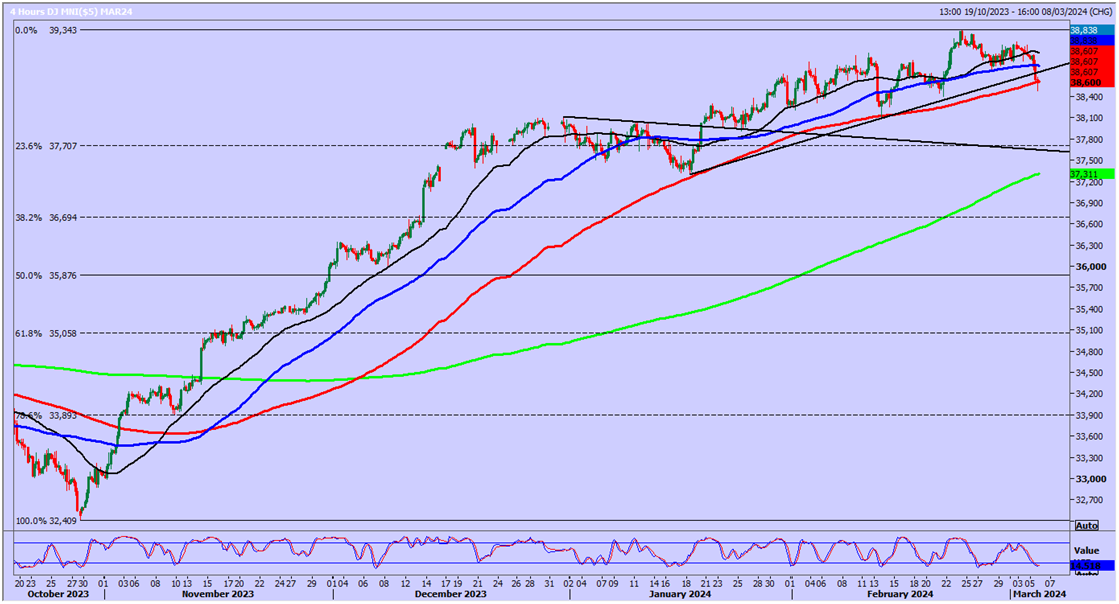 Dow Jones-4-Hr Chart
Emini Dow Jones March futures broke support & collapsed to the next downside target of 38550/500. I am actually concerned that further losses look likely in this market (it has been the weakest of the 3 indices recently).
- A break below 38400 signals further losses with 38100 a realistic target.
- I cannot rule out an eventual move as far as strong support at 37750/650.
- I would even try a short at 38780/820 with stop above 38880. (I very rarely suggest trading against the major trend).
If we continue higher we could meet strong resistance at 38950/39000. Only above here puts bulls back in full control.
It’s not the smartest traders who succeed, nor those who work the longest hours. It’s traders who learn how to control their emotions.


