XAU/USD
+0.54%
Add to/Remove from Watchlist
Add to Watchlist
Add Position
Position added successfully to:
Please name your holdings portfolio
Type:
BUY
SELL
Date:
Amount:
Price
Point Value:
Leverage:
1:1
1:10
1:25
1:50
1:100
1:200
1:400
1:500
1:1000
Commission:
Create New Watchlist
Create
Create a new holdings portfolio
Add
Create
+ Add another position
Close
XAG/USD
+0.40%
Add to/Remove from Watchlist
Add to Watchlist
Add Position
Position added successfully to:
Please name your holdings portfolio
Type:
BUY
SELL
Date:
Amount:
Price
Point Value:
Leverage:
1:1
1:10
1:25
1:50
1:100
1:200
1:400
1:500
1:1000
Commission:
Create New Watchlist
Create
Create a new holdings portfolio
Add
Create
+ Add another position
Close
DX
-0.05%
Add to/Remove from Watchlist
Add to Watchlist
Add Position
Position added successfully to:
Please name your holdings portfolio
Type:
BUY
SELL
Date:
Amount:
Price
Point Value:
Leverage:
1:1
1:10
1:25
1:50
1:100
1:200
1:400
1:500
1:1000
Commission:
Create New Watchlist
Create
Create a new holdings portfolio
Add
Create
+ Add another position
Close
Gold
+0.41%
Add to/Remove from Watchlist
Add to Watchlist
Add Position
Position added successfully to:
Please name your holdings portfolio
Type:
BUY
SELL
Date:
Amount:
Price
Point Value:
Leverage:
1:1
1:10
1:25
1:50
1:100
1:200
1:400
1:500
1:1000
Commission:
Create New Watchlist
Create
Create a new holdings portfolio
Add
Create
+ Add another position
Close
Silver
-0.02%
Add to/Remove from Watchlist
Add to Watchlist
Add Position
Position added successfully to:
Please name your holdings portfolio
Type:
BUY
SELL
Date:
Amount:
Price
Point Value:
Leverage:
1:1
1:10
1:25
1:50
1:100
1:200
1:400
1:500
1:1000
Commission:
Create New Watchlist
Create
Create a new holdings portfolio
Add
Create
+ Add another position
Close
CL
-0.29%
Add to/Remove from Watchlist
Add to Watchlist
Add Position
Position added successfully to:
Please name your holdings portfolio
Type:
BUY
SELL
Date:
Amount:
Price
Point Value:
Leverage:
1:1
1:10
1:25
1:50
1:100
1:200
1:400
1:500
1:1000
Commission:
Create New Watchlist
Create
Create a new holdings portfolio
Add
Create
+ Add another position
Close
SB
-0.14%
Add to/Remove from Watchlist
Add to Watchlist
Add Position
Position added successfully to:
Please name your holdings portfolio
Type:
BUY
SELL
Date:
Amount:
Price
Point Value:
Leverage:
1:1
1:10
1:25
1:50
1:100
1:200
1:400
1:500
1:1000
Commission:
Create New Watchlist
Create
Create a new holdings portfolio
Add
Create
+ Add another position
Close
The one caveat to a sustained equities rally, especially after relatively dovish statements by Powell, is the return of inflation.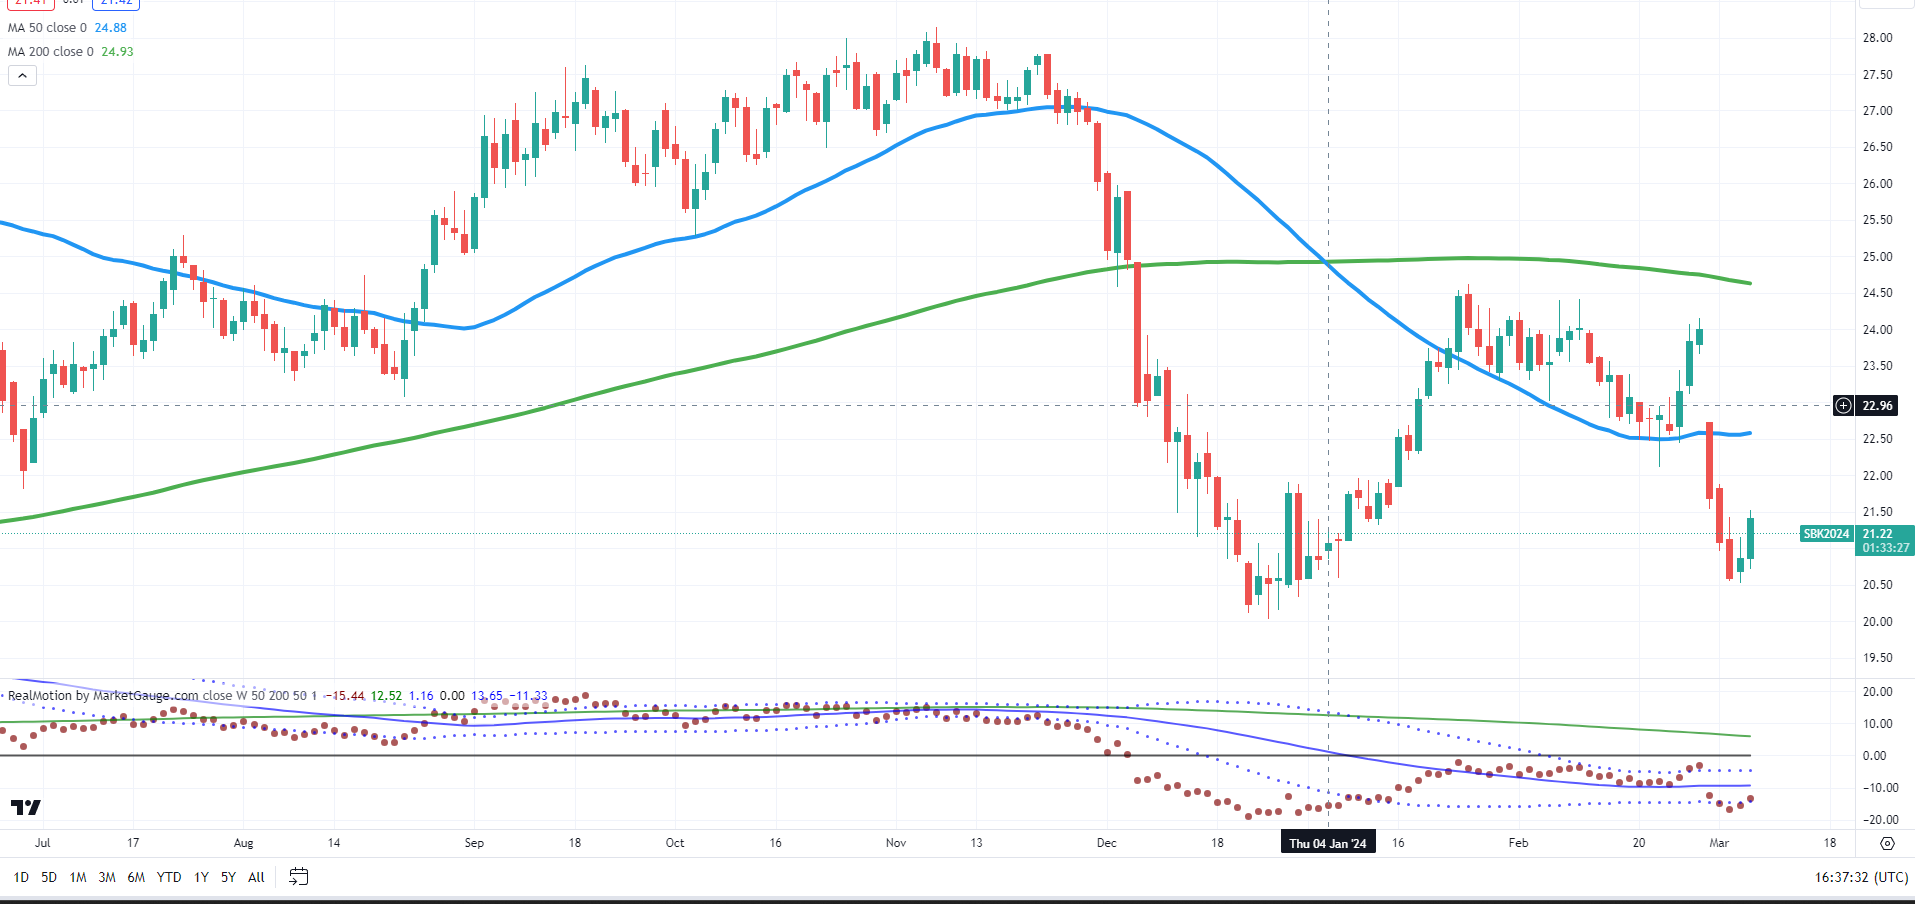

This could happen because of:
- Supply chain and geopolitics
- Government debt and interest on debt
- Government spending
- Weather
- A softening of monetary policy that adds liquidity.
But we will know about inflation by watching:
- Silver-and if it can begin to outperform gold
- Oil, if spikes over $80 a barrel
- Sugar, if even with increased production begins to move up back over 23 cents a pound
- The dollar fails 103 and selling pressure returns. Rumor has it through Russia that BRICS is working to create an independent payment system based on digital currencies and blockchain
For today, let’s focus on sugar.
Sugar prices rally during El Nino weather patterns.
With heavy rains in Brazil and drought in India, these factors negatively impact sugar crop production.
El Nino in Thailand has created issues with millers reporting the lowest yield from crushed cane in the least 13 years.
India, the second-largest sugar producer in the world, reported that output fell and has maintained their restrictions on sugar exports.
In past Daily’s I have written about why sugar is a reliable barometer for inflation.
Looking at the futures chart, a move over 22.50 cents would be the start of a potential double bottom going back from December.
It would also clear a key moving average.
On our Real Motion momentum indicator, sugar had a mean reversion.
Now with gold and silver rallying, the dollar falling and Powell into the do-nothing mode on rates, sugar could just be the key.
ETF Summary
- S&P 500 (SPY) 510 pivotal-as in below could see more correction
- Russell 2000 (IWM) Unless clears back over 277.70, the reversal top could bring this back to 198 quickly
- Dow (DIA) 385 support 400 resistance
- Nasdaq (QQQ) After the potential reversal top, this had an inside day so watch
- Regional banks (KRE) 45-50 range
- Semiconductors (SMH) Another new high for our wonder woman!
- Transportation (IYT Looks better especially is this continues to a new ATH
- Biotechnology (IBB) 140-142 resistance 135 support
- Retail (XRT) Granny had a rough day-this makes us a bit cautious. 73 support
- iShares iBoxx Hi Yd Cor Bond ETF (HYG) 77 big number to hold (still)