These Cryptocurrencies Are Poised for Big Post-CPI Report Moves: How to Trade Them
ARBm/USD
-3.79%
Add to/Remove from Watchlist
Add to Watchlist
Add Position
Position added successfully to:
Please name your holdings portfolio
Type:
BUY
SELL
Date:
Amount:
Price
Point Value:
Leverage:
1:1
1:10
1:25
1:50
1:100
1:200
1:400
1:500
1:1000
Commission:
Create New Watchlist
Create
Create a new holdings portfolio
Add
Create
+ Add another position
Close
LINK/USD
-3.72%
Add to/Remove from Watchlist
Add to Watchlist
Add Position
Position added successfully to:
Please name your holdings portfolio
Type:
BUY
SELL
Date:
Amount:
Price
Point Value:
Leverage:
1:1
1:10
1:25
1:50
1:100
1:200
1:400
1:500
1:1000
Commission:
Create New Watchlist
Create
Create a new holdings portfolio
Add
Create
+ Add another position
Close
TRX/USD
-1.61%
Add to/Remove from Watchlist
Add to Watchlist
Add Position
Position added successfully to:
Please name your holdings portfolio
Type:
BUY
SELL
Date:
Amount:
Price
Point Value:
Leverage:
1:1
1:10
1:25
1:50
1:100
1:200
1:400
1:500
1:1000
Commission:
Create New Watchlist
Create
Create a new holdings portfolio
Add
Create
+ Add another position
Close
BTC/USD
-1.86%
Add to/Remove from Watchlist
Add to Watchlist
Add Position
Position added successfully to:
Please name your holdings portfolio
Type:
BUY
SELL
Date:
Amount:
Price
Point Value:
Leverage:
1:1
1:10
1:25
1:50
1:100
1:200
1:400
1:500
1:1000
Commission:
Create New Watchlist
Create
Create a new holdings portfolio
Add
Create
+ Add another position
Close
- Bitcoin’s recent rebound above $70,000 signals a potential continuation of its upward trend, driven by institutional demand through ETFs.
- The next target for Bitcoin could be $83,300, with stability around $70,000, and positive trading volume raises the possibility of reaching $83,000 – $100,000 in the summer.
- The upcoming US CPI data holds significance for Bitcoin and could trigger volatile moves in other cryptos like Chainlink, Tron, and Arbitrum.
- Invest like the big funds for less than $9 a month with our AI-powered ProPicks stock selection tool. Learn more here>>
Bitcoin bounced back after a recent price correction and is now trading above $70,000 this week. The long-term view reveals a strong upward trend since February and a break out of the rising channel, signaling a potential for further rises.
The recent surge has been fueled by institutional demand through ETFs, and if this demand persists, Bitcoin’s upward momentum is likely to continue.
Looking ahead, the next target for Bitcoin could be $83,300, given its current stability around $70,000. With the current trading volume, there’s an increasing possibility of Bitcoin reaching the $83,000 – $100,000 range in the summer.
In the case of a pullback, a potential decline to $68,500 followed by support at this level is expected to sustain the current trend. However, a drop below $68,500 increases the risk of Bitcoin retracing to the $63,000 region.
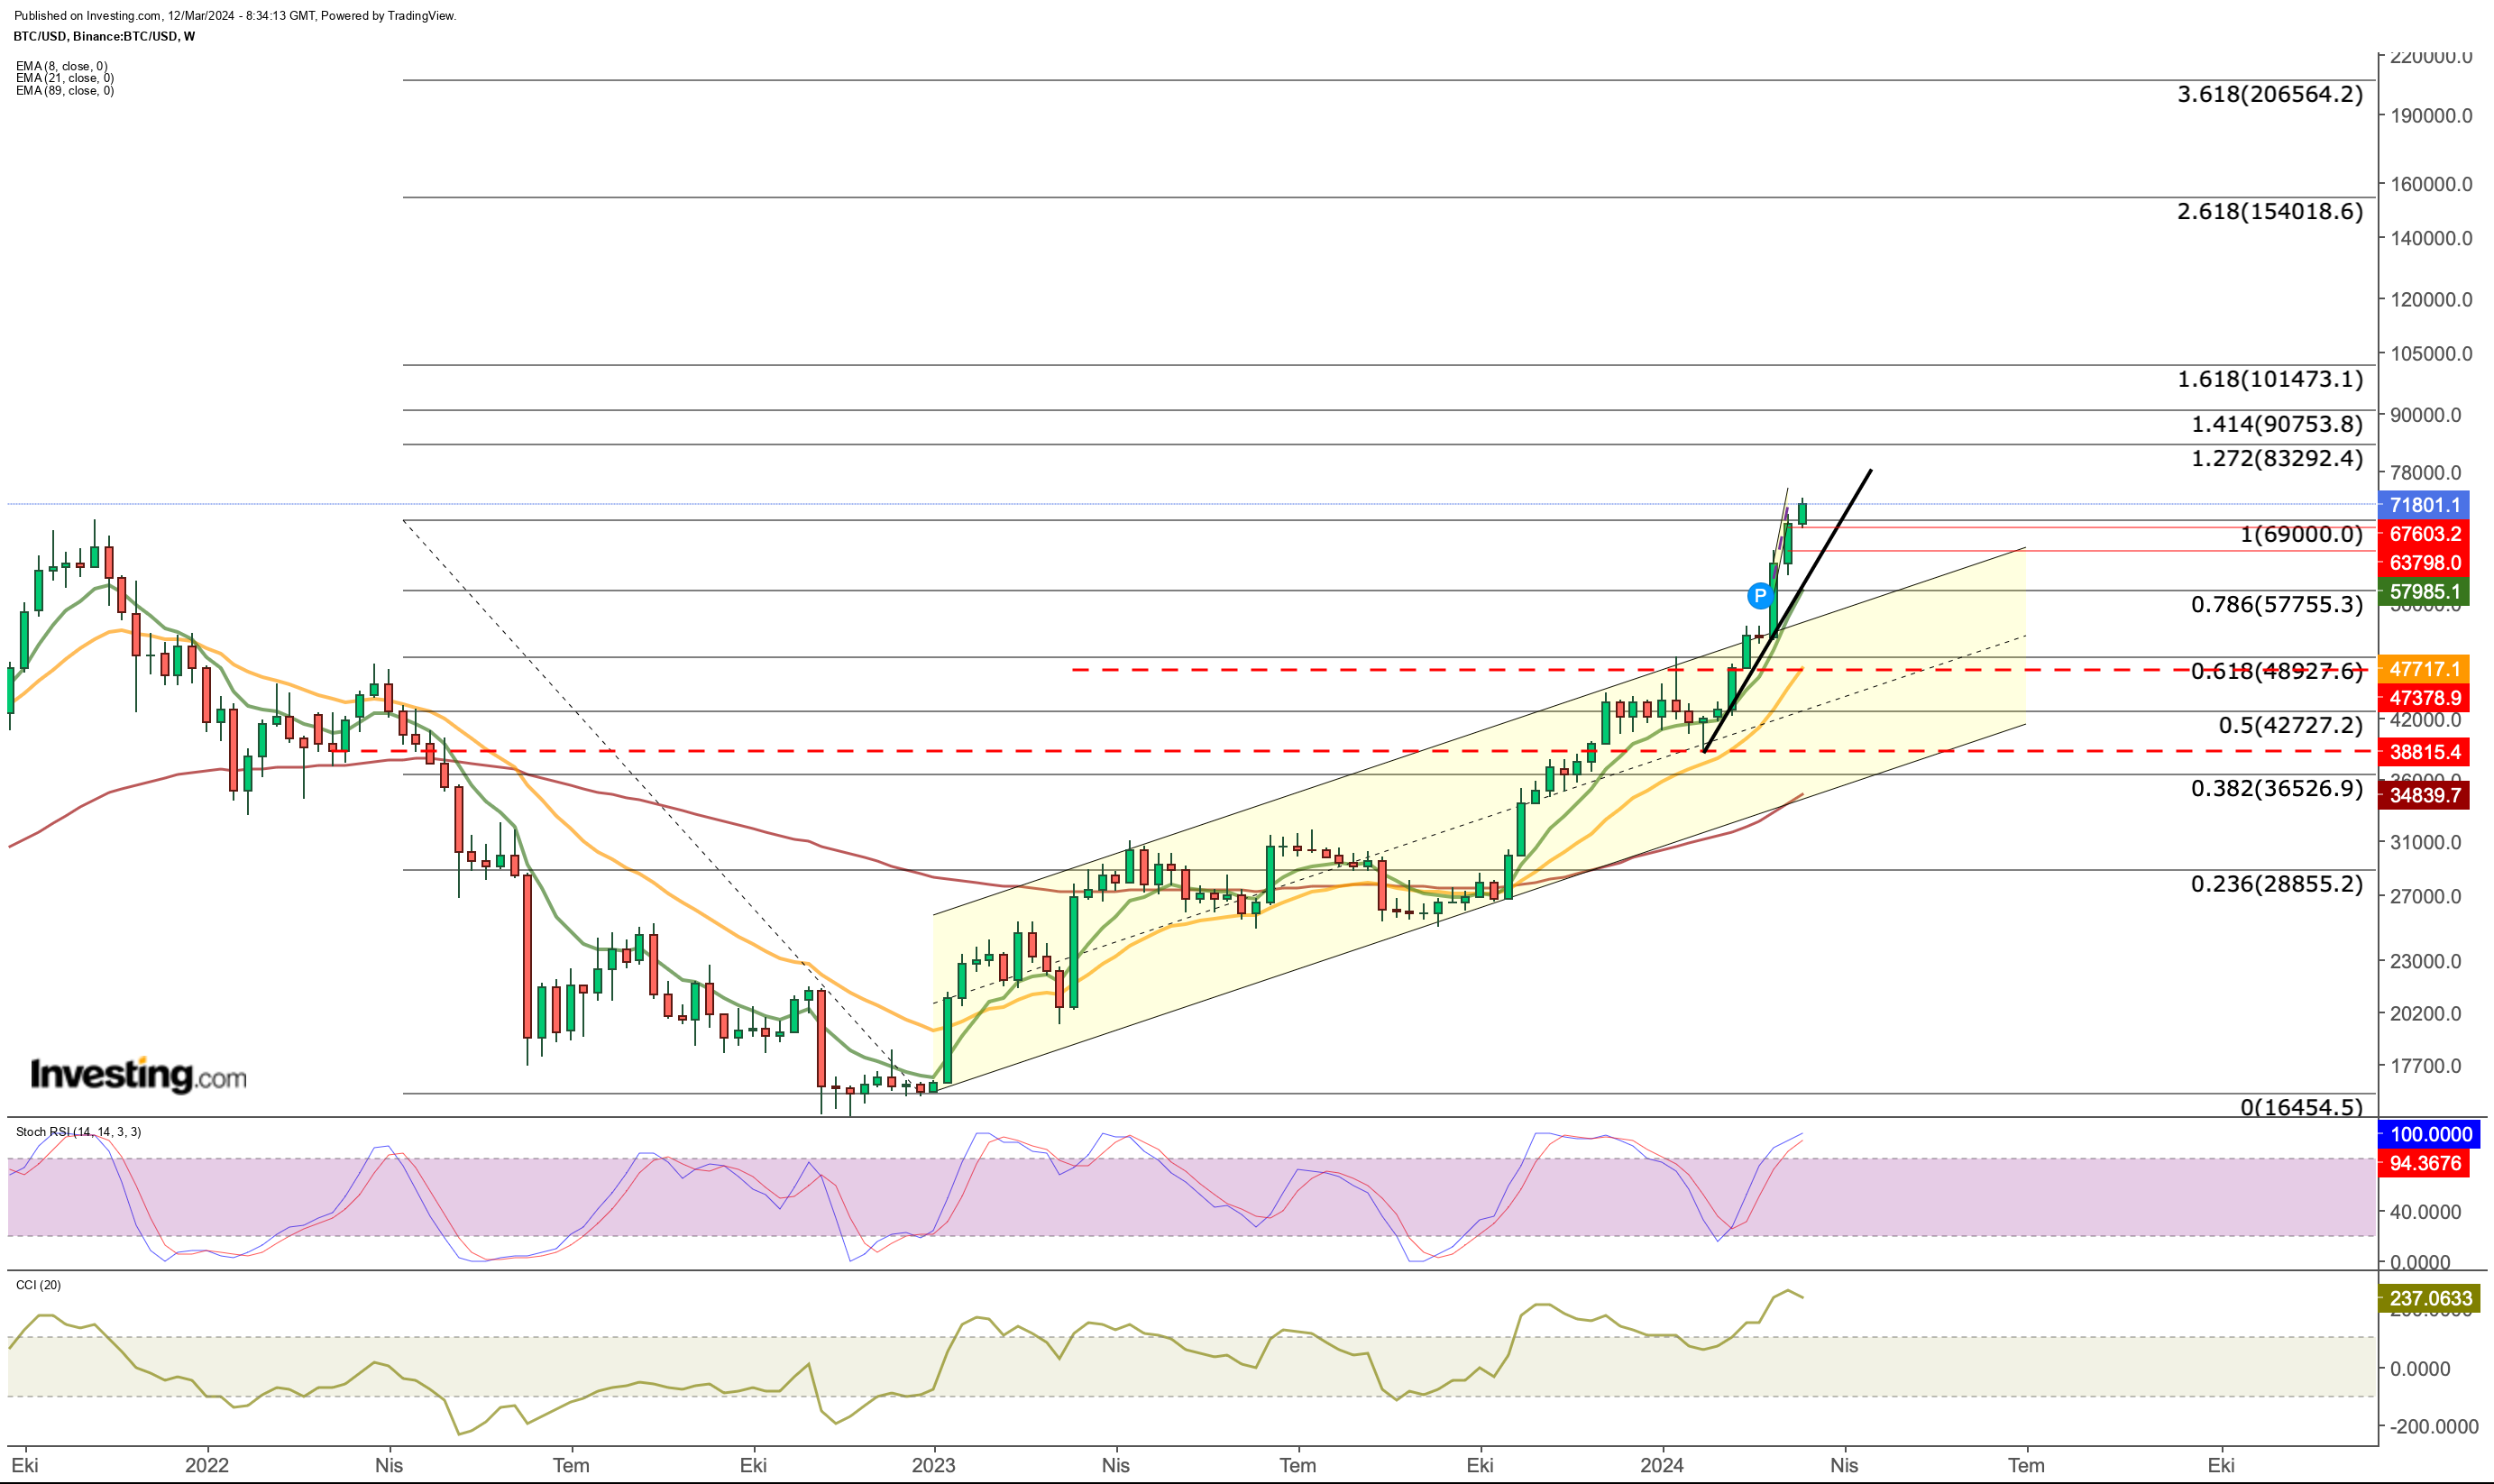 BTC Weekly Chart
CPI Above Expectations Could Fuel Selling Pressure
The US CPI data can significantly influence Bitcoin prices, along with other markets, as it plays a crucial role in the Fed’s interest rate decisions.
If the data exceeds expectations, similar to what happened in January, it might trigger a sell-off in Bitcoin and other risk assets. Investors may anticipate a more hawkish stance from the Fed.
On the other hand, if inflation aligns with expectations, it could be viewed as a step toward continued monetary easing. This scenario may support Bitcoin bulls, depending on the prevailing risk appetite.
Over the last month, Bitcoin has witnessed a remarkable 50% increase in value.
Meanwhile, altcoins like LINK/USD, TRX/USD, and ARBm/USD, with significant market capitalization, have exhibited diverse price movements.
In this analysis, we will assess the current status of these three altcoins.
1. Chainlink (LINK)
In the general upward trend that started in October, LINK is known for its reactions at long-term resistance levels.
Based on the 2021 peak and the $5 level, which was used as the bottom price for a long time, LINK had a very difficult time passing the Fib 0.236 value in the $15 band from November to January last year.
 LINK Weekly Chart
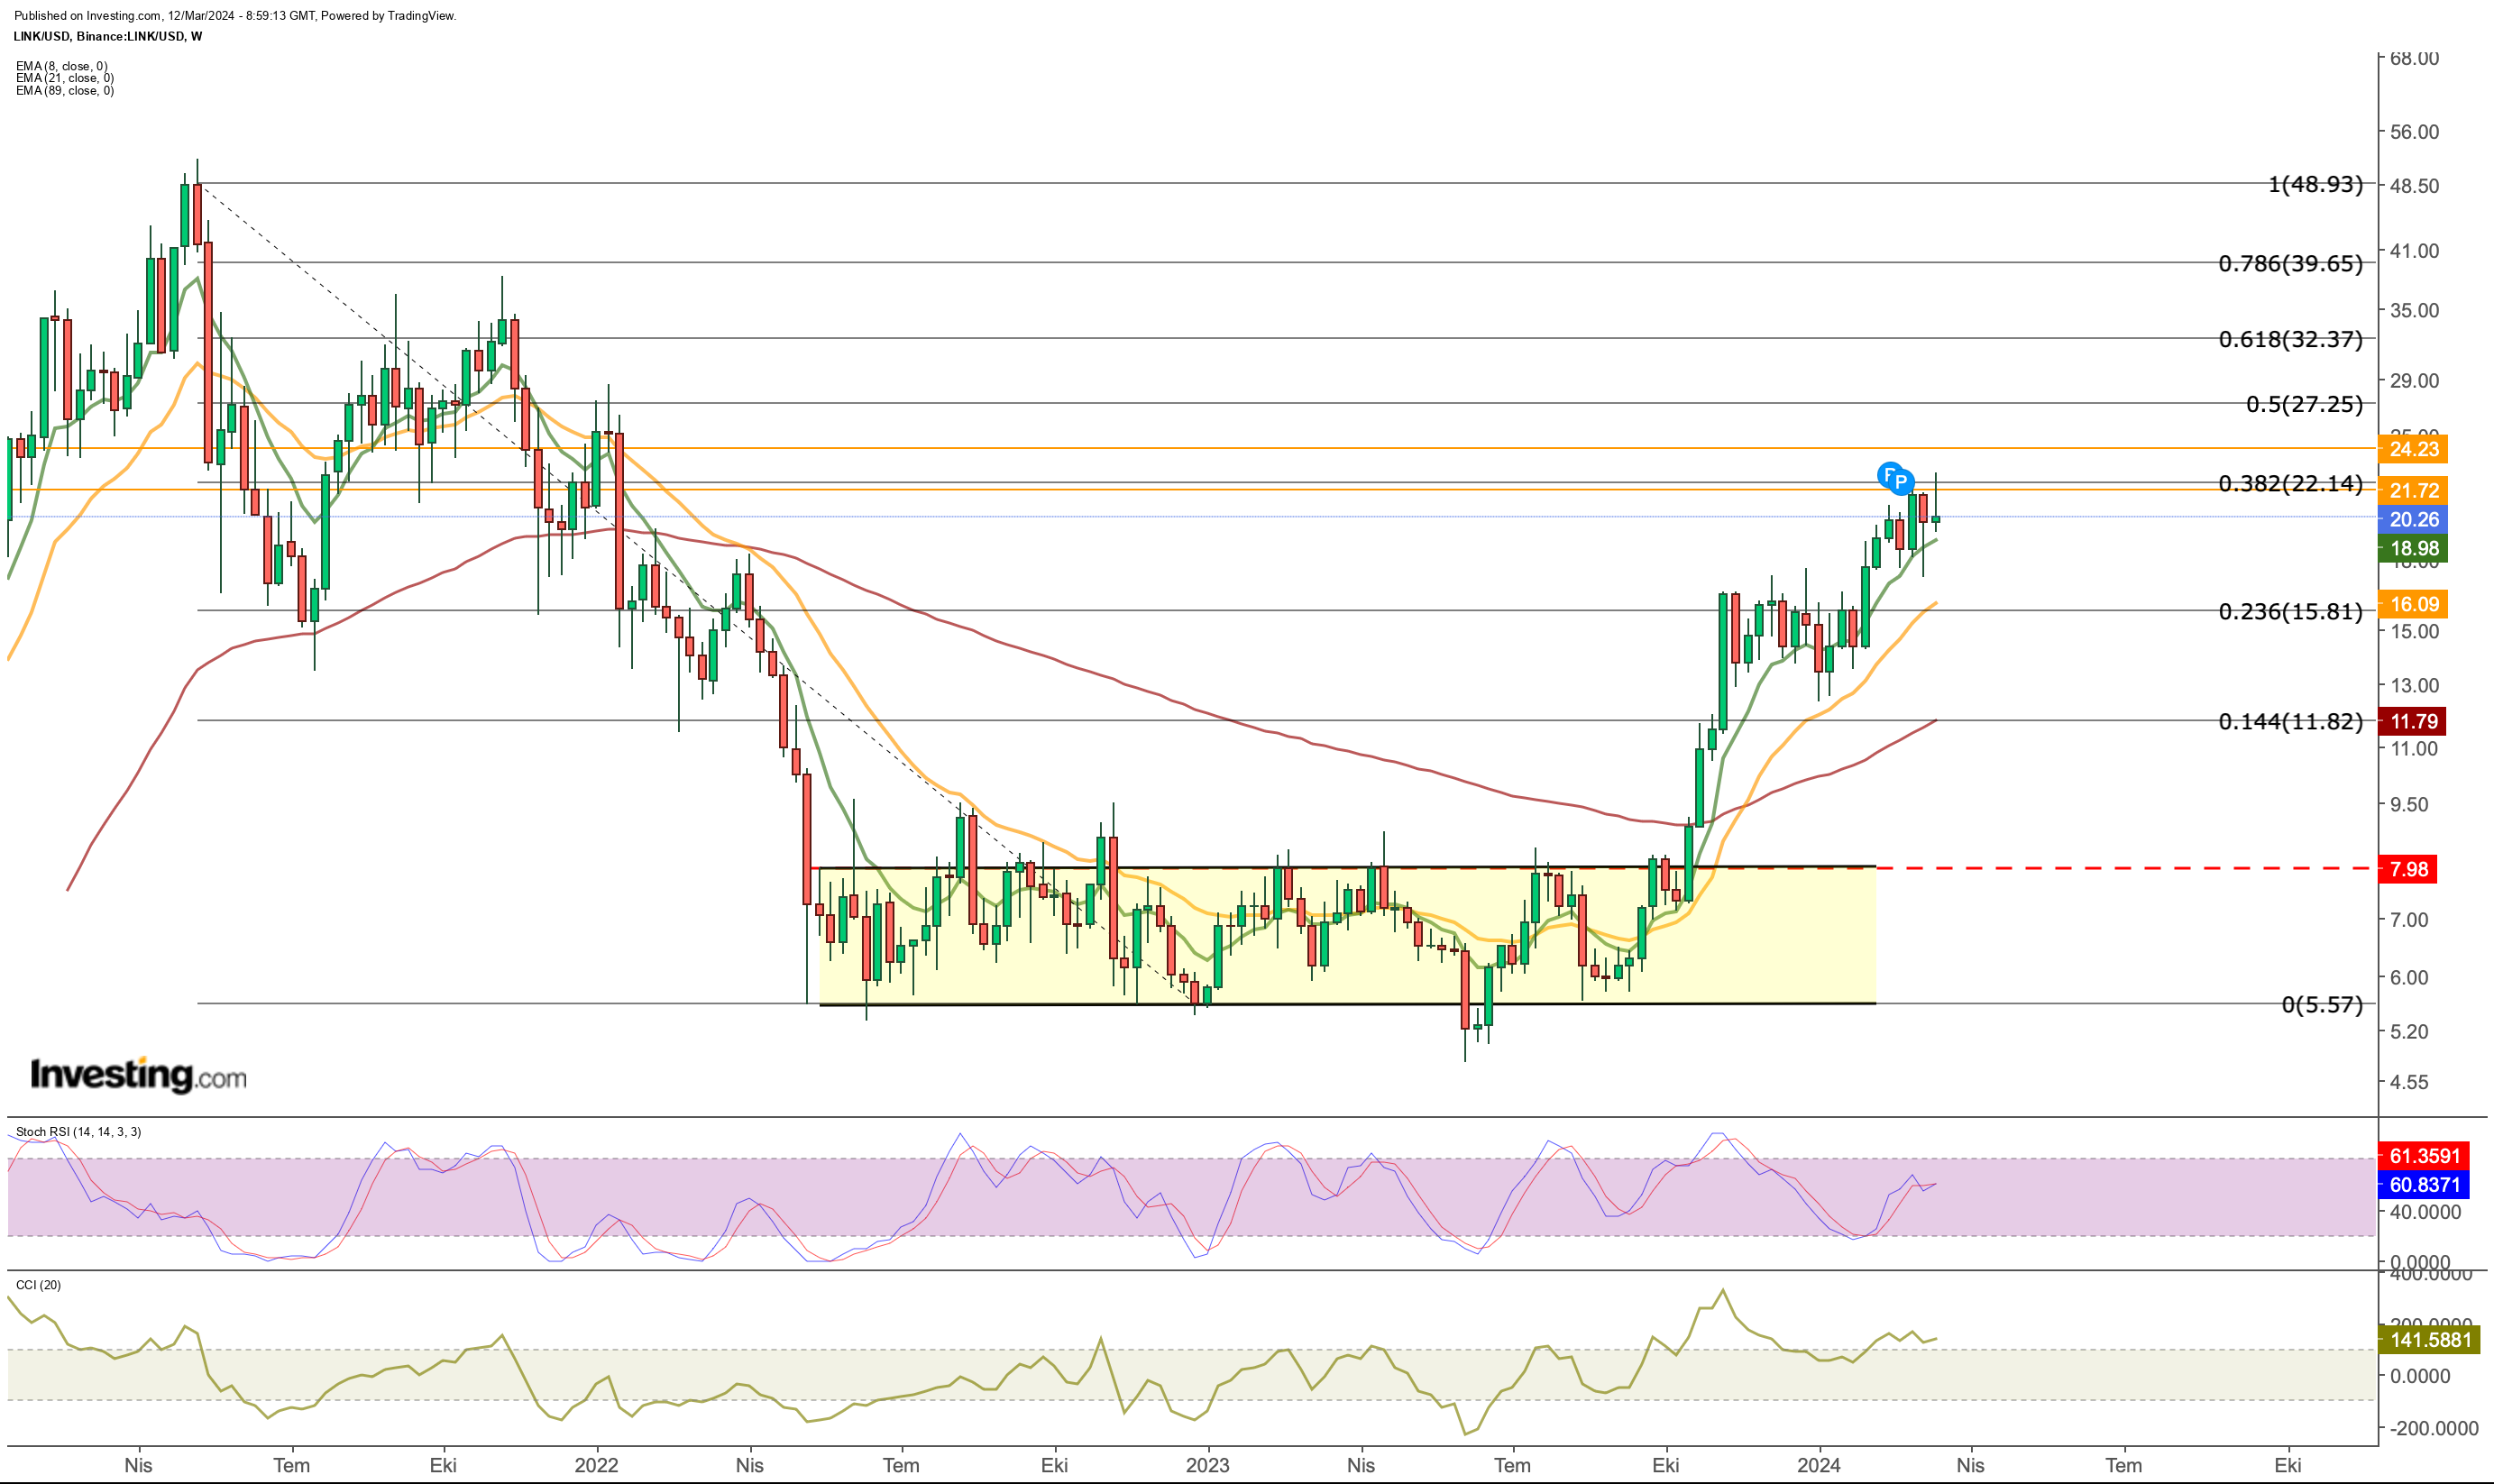
LINK, which broke this resistance with the additional demand increase towards February, tends to create a similar outlook in the resistance zone at the $ 22 level.
If the $ 22 zone, which appears as a critical resistance price such as Fib 0.382 on the way up, can be broken with weekly closures, the next target for cryptocurrency could be $ 32.
A move above the $ 32 level can be seen as the last obstacle for LINK to reach a new record high according to the long-term outlook. In the long-term outlook, the last peak above $ 32 does not seem to be a difficult obstacle until $ 50.
Although LINK has been flat in the last month, it is seen that the Stochastic RSI continues to generate signals for upward movement for the cryptocurrency, which maintains its bullish outlook during this consolidation phase.
In summary, for LINK to continue on its way, it will be followed as the first condition to see a weekly close above the $ 22 zone.
Support levels for LINK can be followed as $ 18 and then the $ 16 band. We can see that buyers can come into play in these two price ranges in the possible general correction movement.
2. Tron (TRX)
TRX, one of the cryptocurrencies that draws a different chart from the overall market, started its recovery period after finding support at $ 0.05 in November 2022.
TRX Weekly Chart
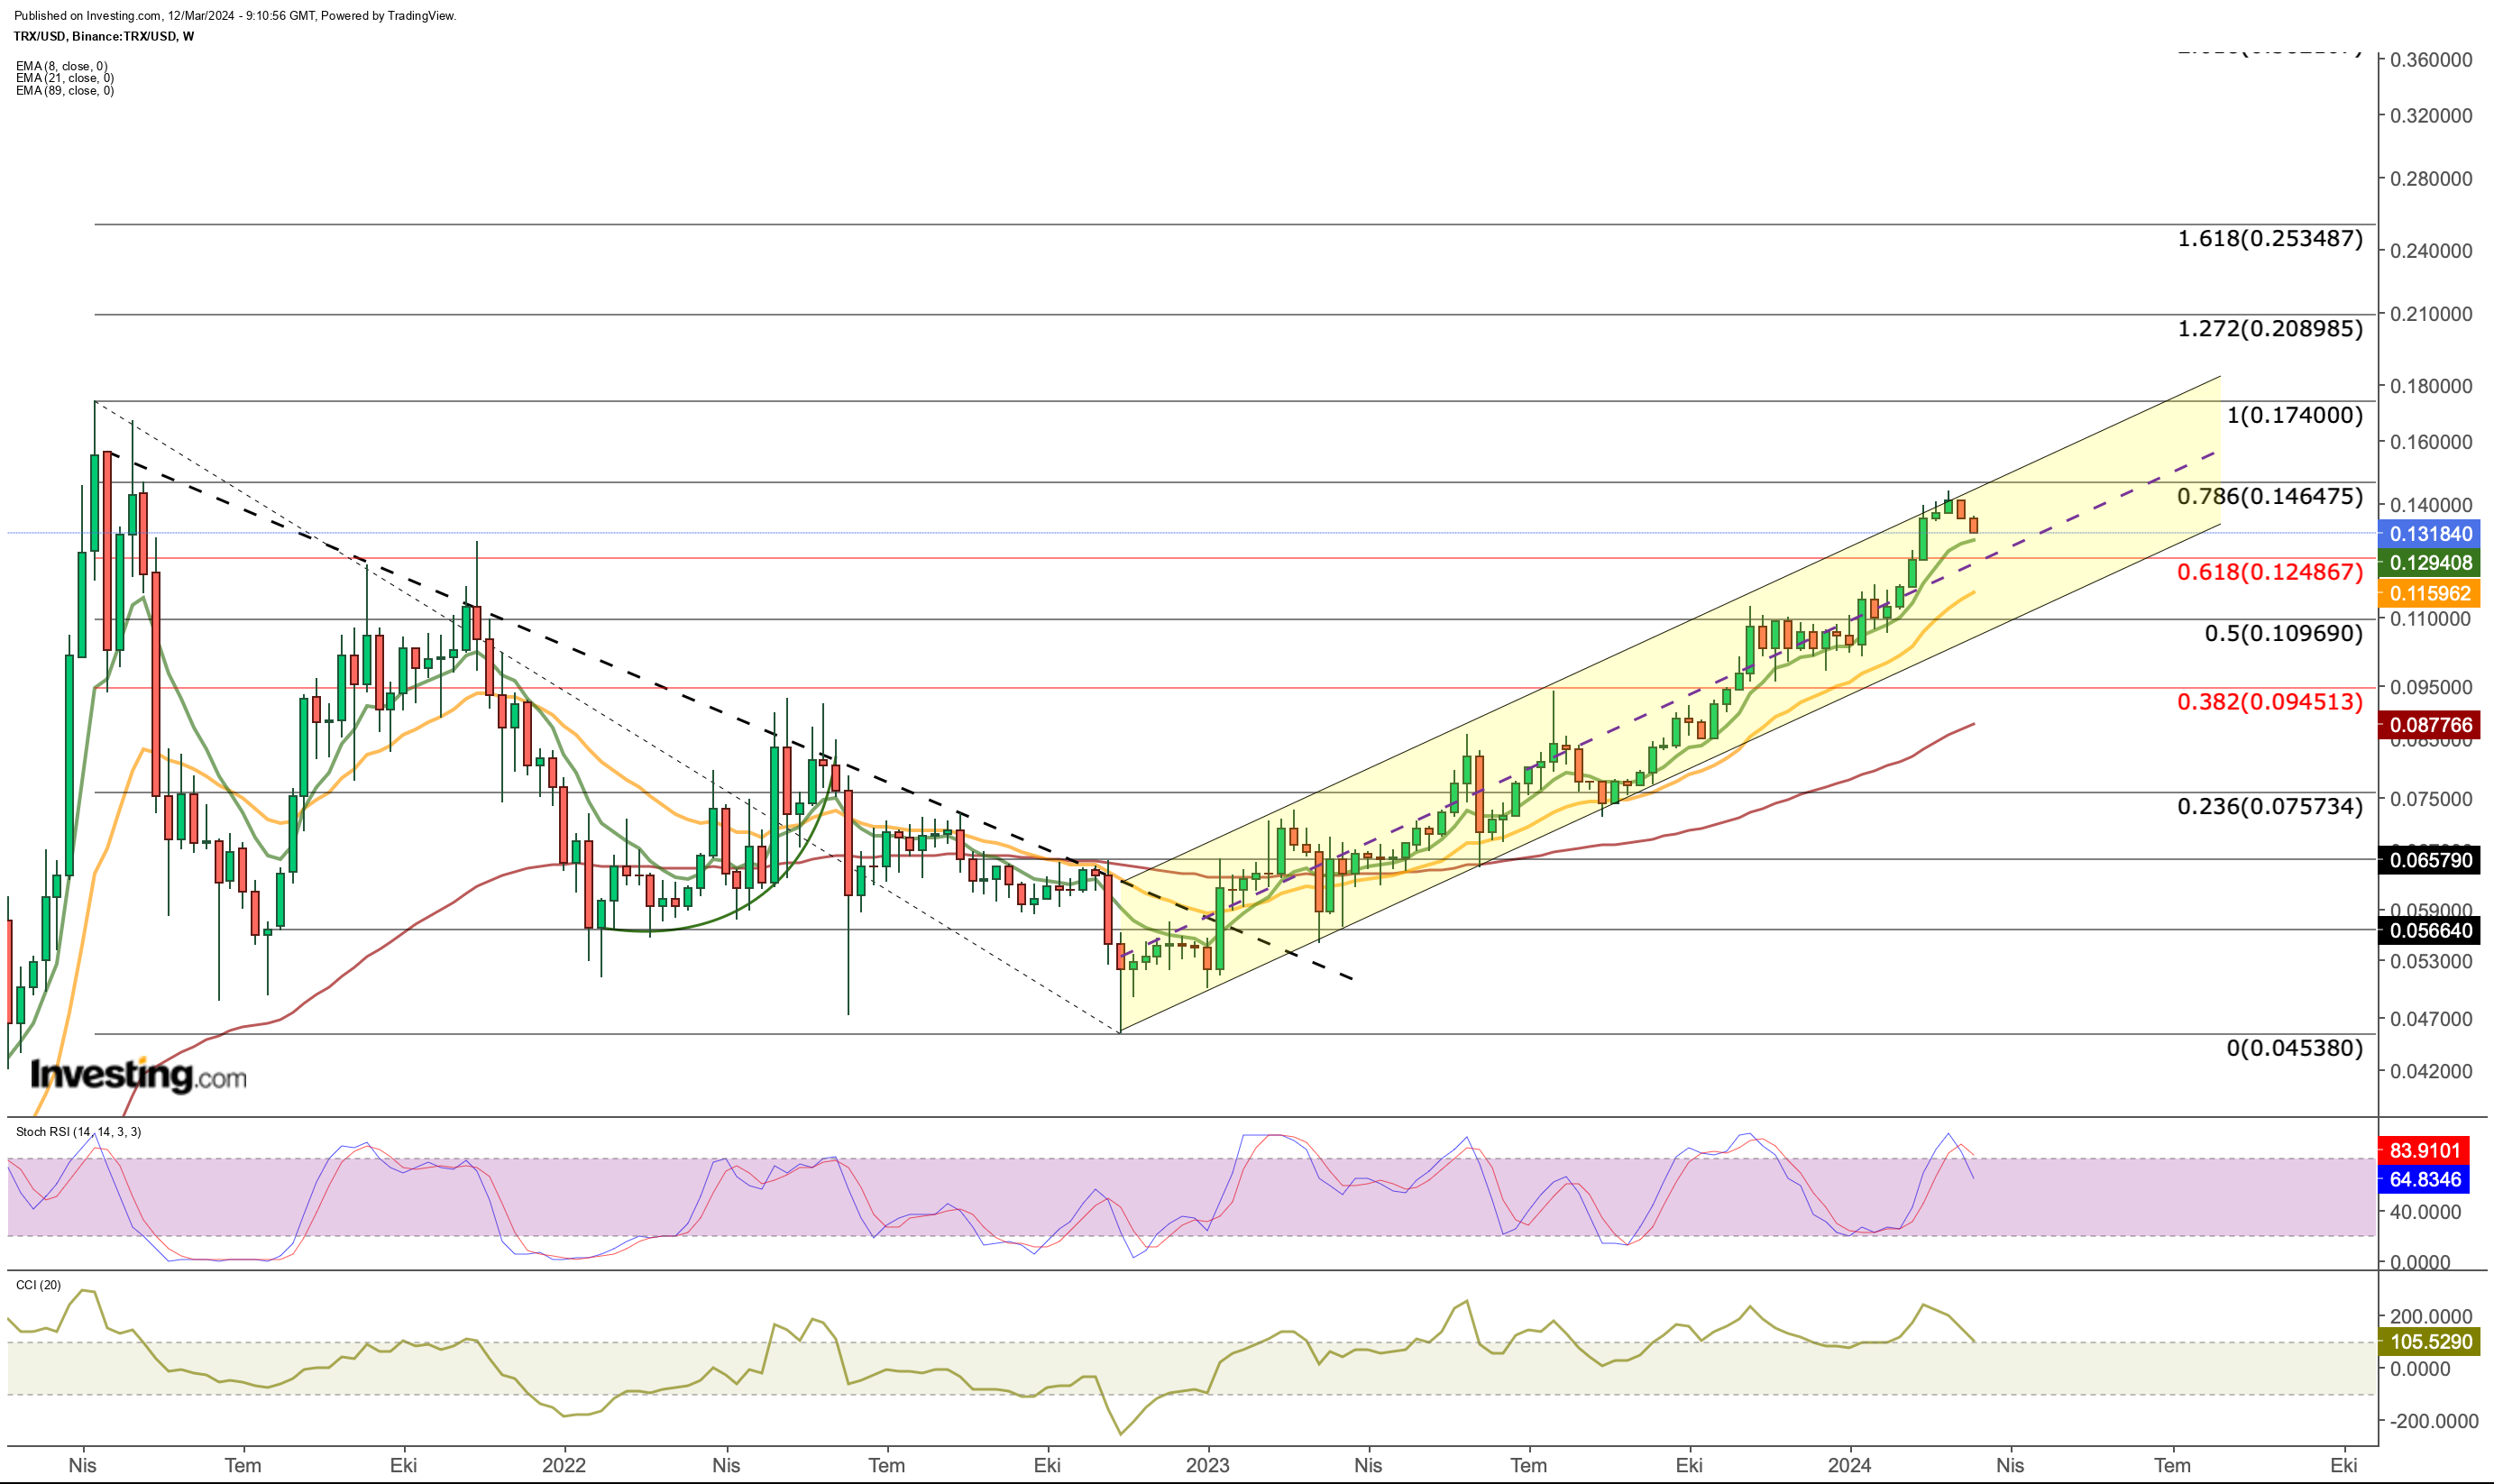
TRX, which has been continuing its uptrend for about 1.5 years, has seen a pause in the last month in the region corresponding to Fib 0.786 according to the upper band of the channel and long-term Fibonacci levels.
TRX, which has recorded bearish declines since last week, has a support line up to $ 0.125 according to the current situation.
In the case of short-term selling, as we saw in recent days in the retracements towards this point, TRX may also experience a temporary decline up to $ 0.115.
However, according to the current outlook, these regions may continue as a buying opportunity and the cryptocurrency may break the resistance in the $ 0.14 region and trade in the $ 0.174 – $ 0.174 band in the summer after $ 0.2 – $ 0.25.
3. Arbitrum (ARB)
ARB, one of the popular cryptocurrencies with a different chart in the first quarter of 2024, started the year by staying horizontal in the range of $ 1.67 – $ 2.25.
ARB Price Chart
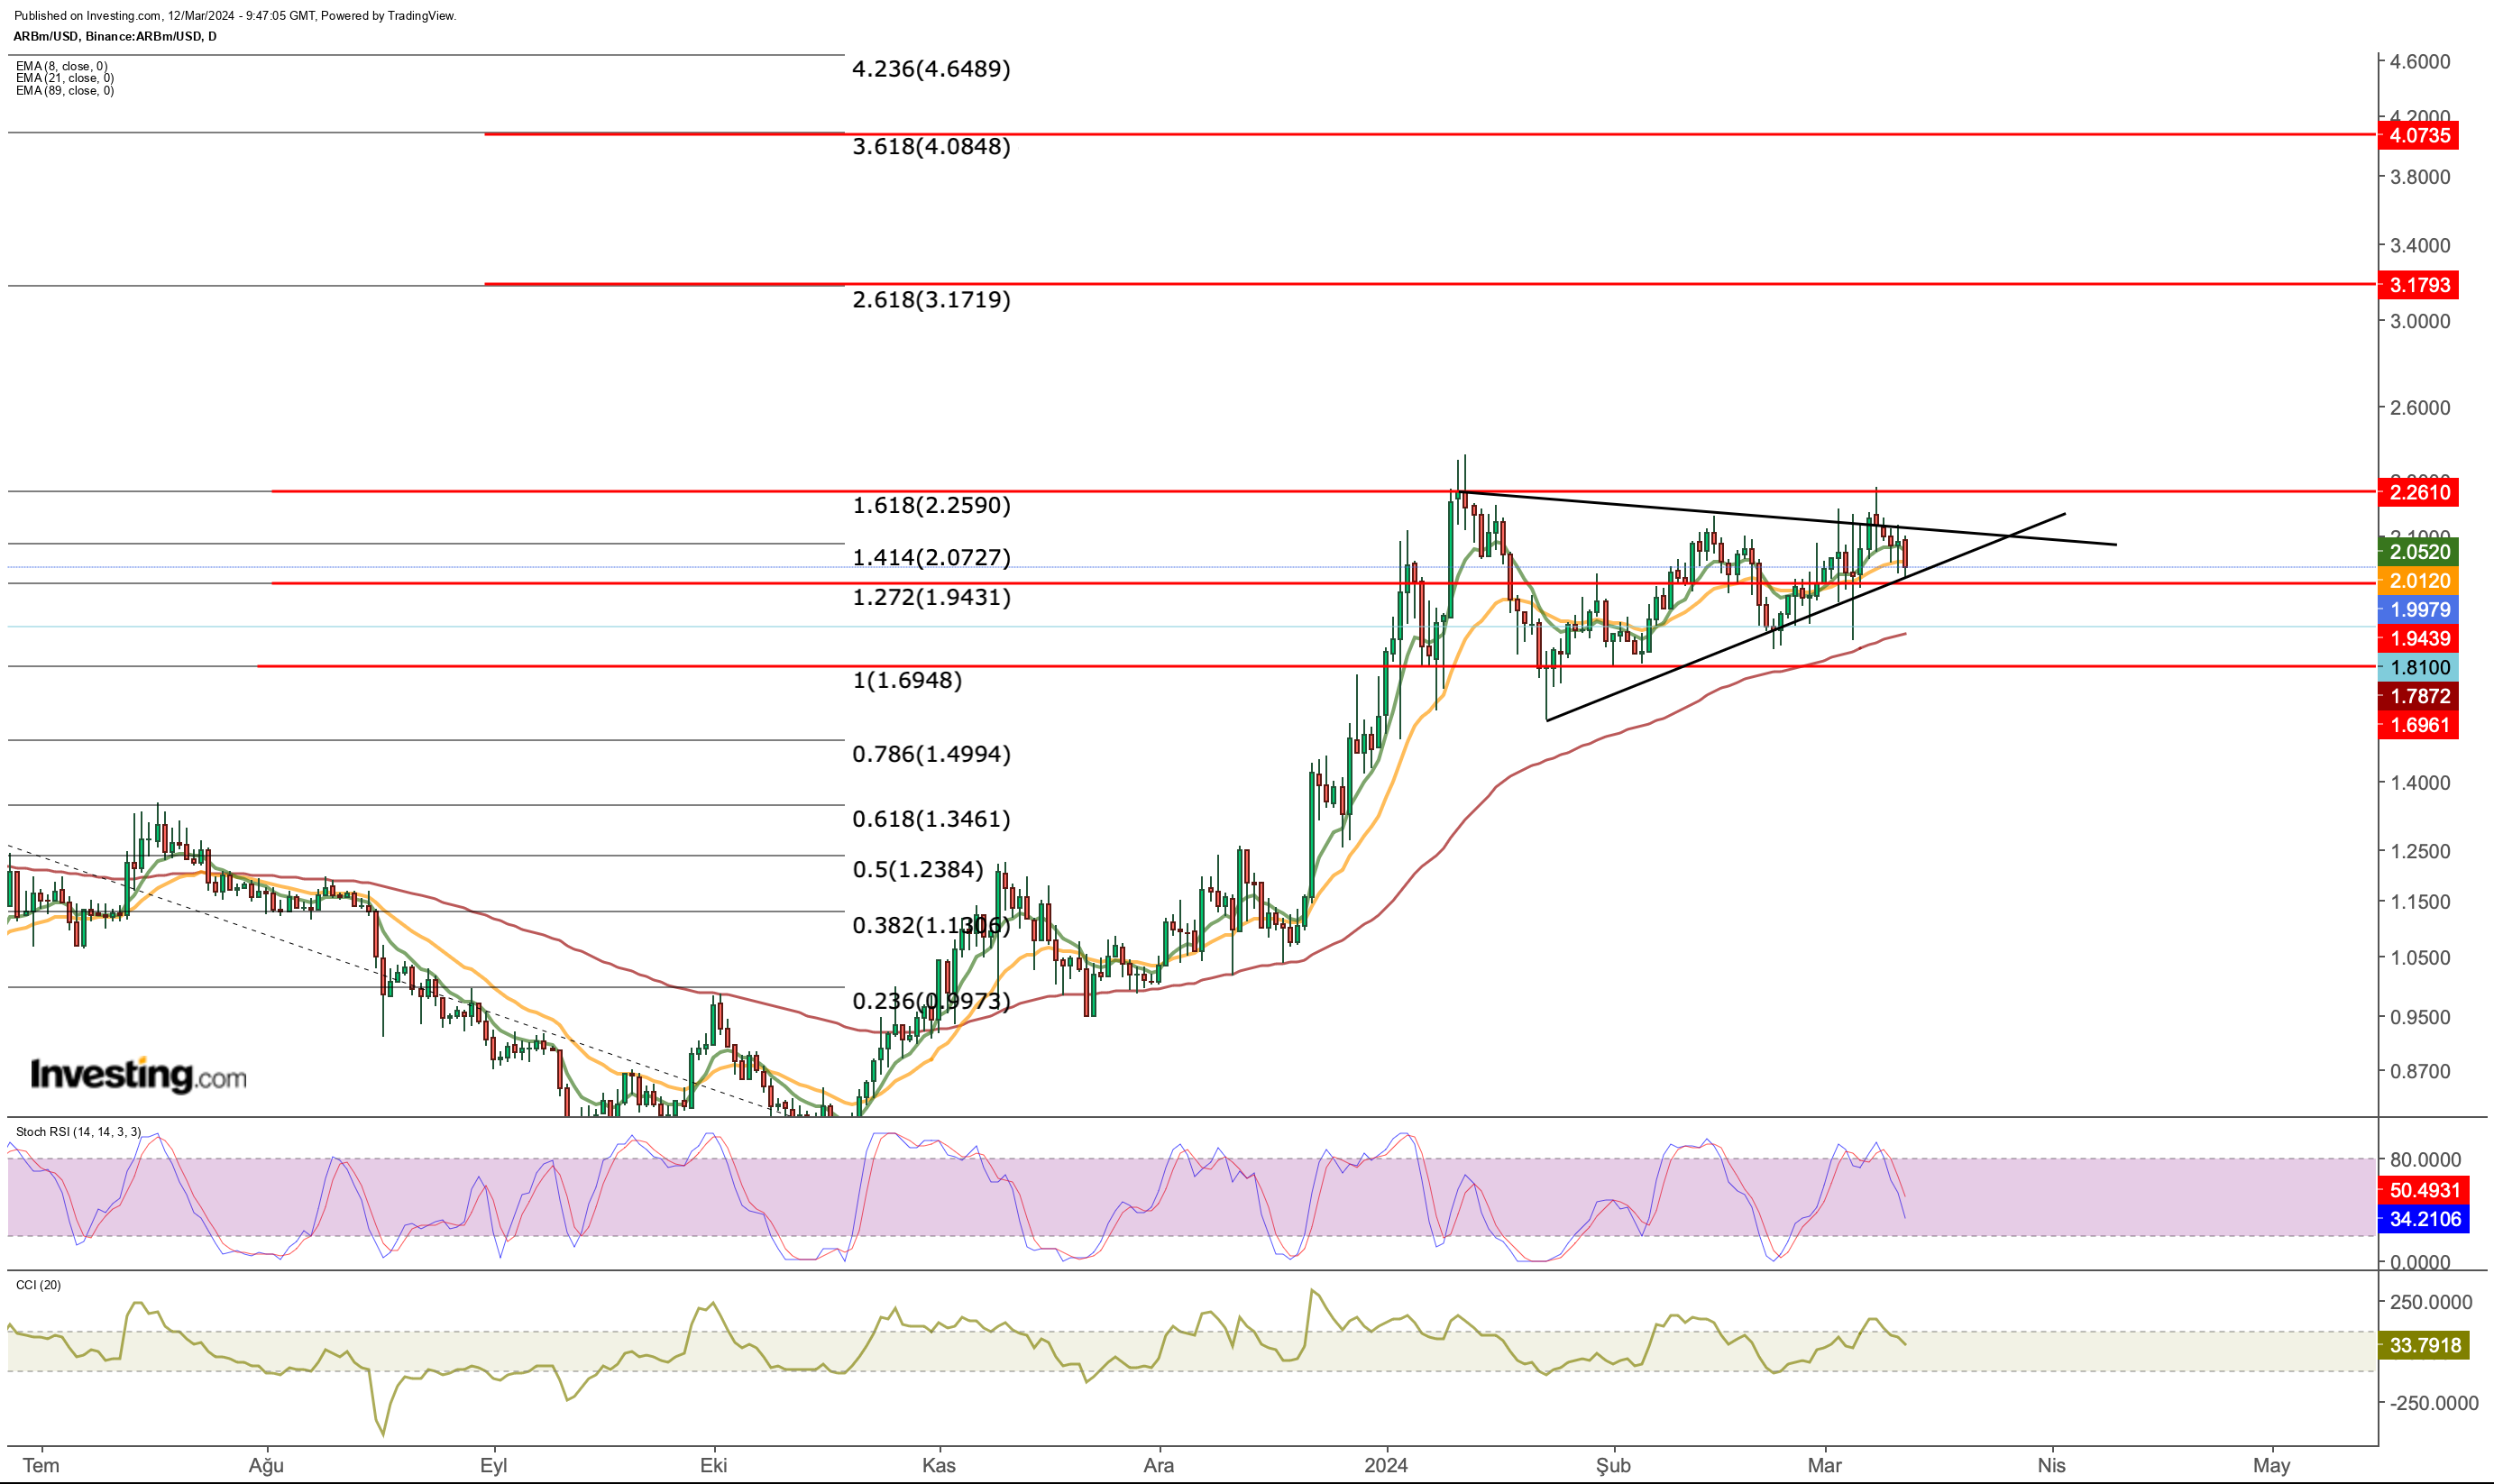
ARB is testing its support at $1.95 (Fib 1,272) this week. This price level stands as the price level to be maintained for a possible upside breakout.
Then, a decisive crossing of the resistance zone in the $2.15 – $2.25 area could lead to the cryptocurrency’s next trading range in the $3 – $4 area.
The symmetrical triangle pattern that formed between January and March also reflects a price squeeze in ARB.
Depending on this price squeeze, if the breakout occurs downward below $ 1.95, it seems likely that the downward momentum will continue until $ 1.7.
This region may appear as a buying zone, given that demand for cryptocurrency markets remains strong.
***
Be sure to check out InvestingPro to stay in sync with the market trend and what it means for your trading. As with any investment, it’s crucial to research extensively before making any decisions.
InvestingPro empowers investors to make informed decisions by providing a comprehensive analysis of undervalued stocks with the potential for significant upside in the market.
Subscribe here for under $9/month and never miss a bull market again!
 Subscribe Today!
Disclaimer:


