Where can we expect the Nasdaq 100 to top?
NDX
+0.44%
Add to/Remove from Watchlist
Add to Watchlist
Add Position
Position added successfully to:
Please name your holdings portfolio
Type:
BUY
SELL
Date:
Amount:
Price
Point Value:
Leverage:
1:1
1:10
1:25
1:50
1:100
1:200
1:400
1:500
1:1000
Commission:
Create New Watchlist
Create
Create a new holdings portfolio
Add
Create
+ Add another position
Close
Unfortunately, we have not been able to provide an update on the Nasdaq 100 since mid-February. Since then, we have been tracking the Elliott Wave Principle’s (EWP) “green W-5” that we postulated back then:
“…given that the rally from the October 2023 low was essentially straight up with very consecutive few down days, besides the five-day decline into the January 5 low, the correct interpretation of the price action from an EWP perspective is more complex. As such, yesterday may only be the green W-3 of the red W-v. … and a pullback to around NDX17100+/-100 and NAS15250+/-100 for the green W-4, followed by another rally for the green W-5, should be anticipated.”
Moreover, the NDX traded at around $17600 when we wrote our last update. Fast forward, and today, it is trading in the $18420s. A ~4.7% gain in five weeks. Thus, it pays to stay informed more often than once a month. We have since updated our understanding of the market’s price pattern and view the index as completing a final (grey) W-v of “the green W-5,” ideally at around $18700+/-100 via what is called in EWP-terms an ending diagonal (ED). See Figure 1 below.
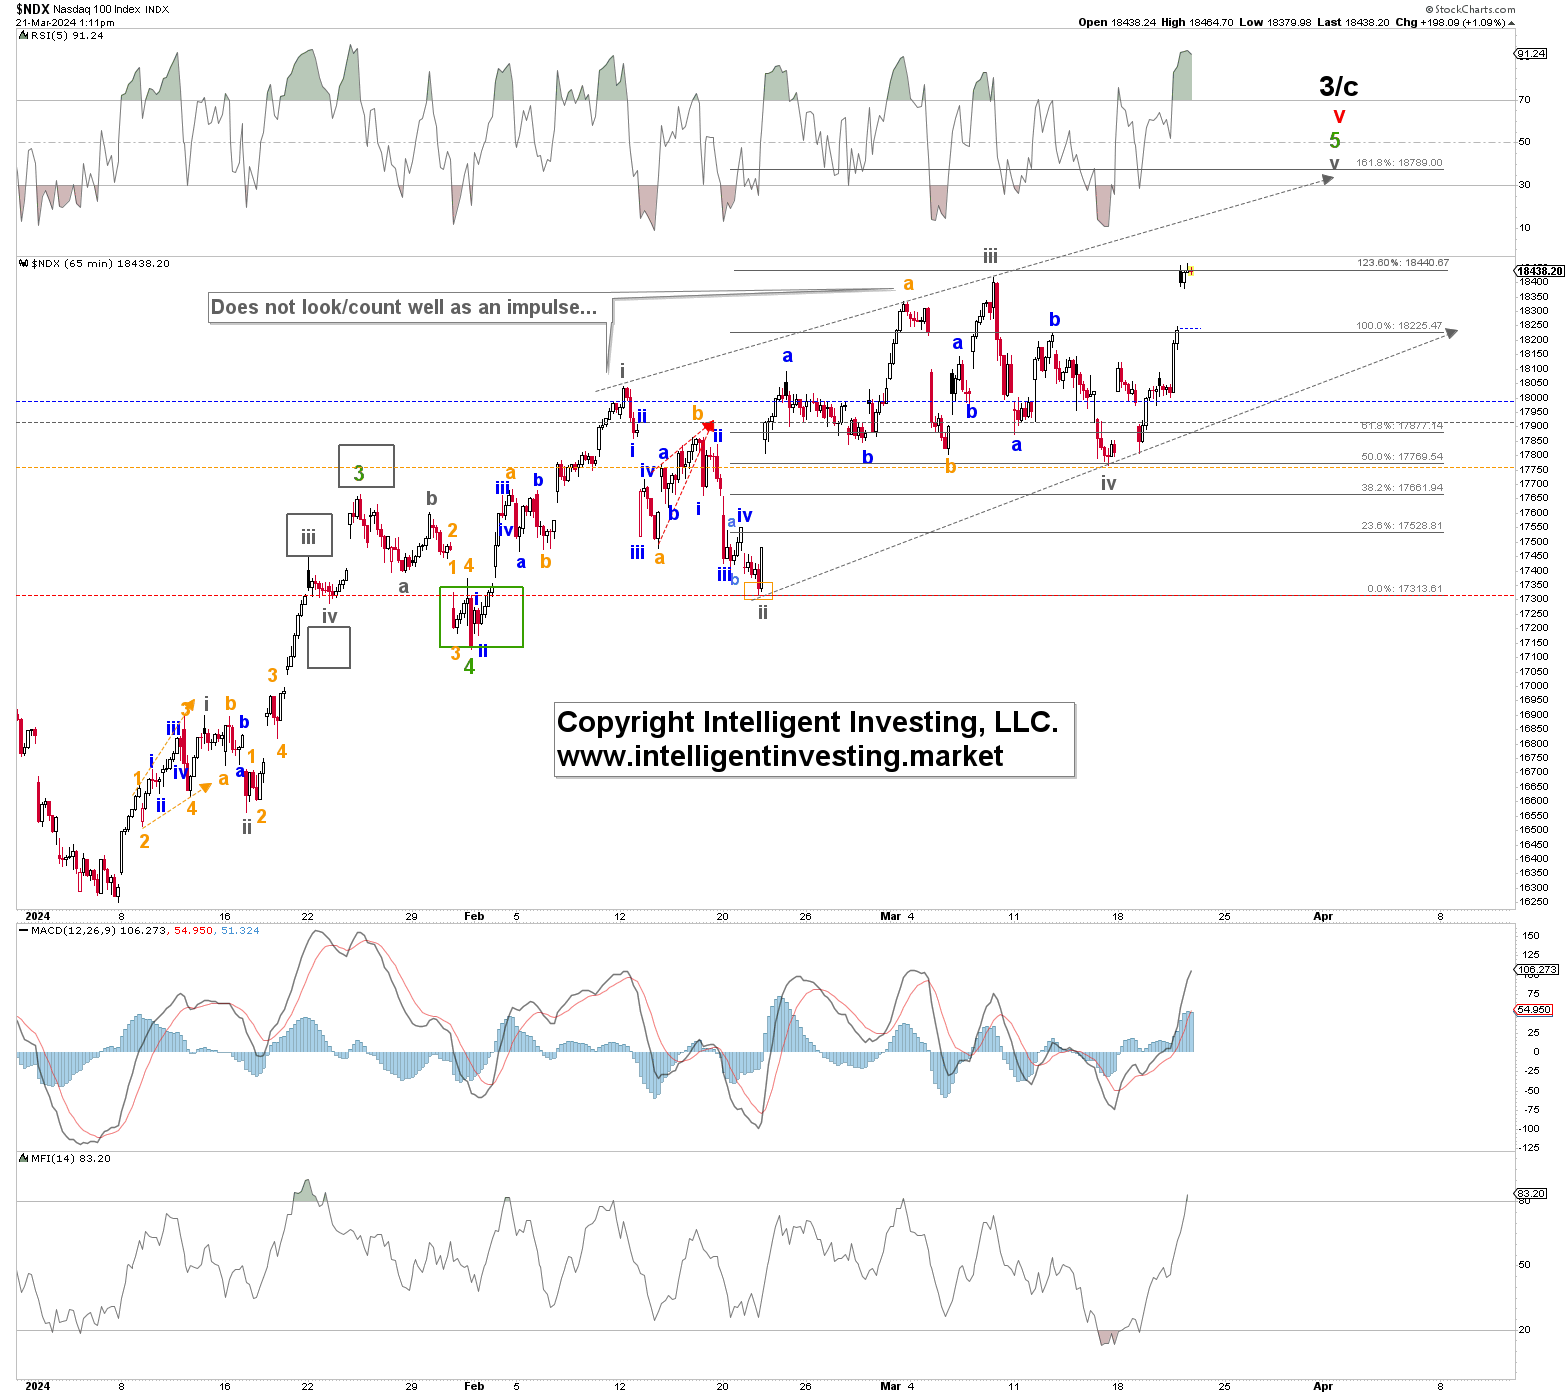 NDX Hourly Chart
In a five-wave ending diagonal, the wave structure is most often a 3-3-3-3-3 count as all five of the waves of an ending diagonal break down to only three waves each, indicating exhaustion of the larger degree trend. Also, Wave 1 and Wave 4 may overlap with each other. Most ending diagonals have a wedge shape where they fit within two converging lines. The 3rd, 4th, and 5th waves often reach the 123.60%, 50.0-62.8%, and 161.80% Fibonacci extensions of W-1, measured from the W-2 low, respectively. In Figure 1 above, we can see that W-i, ii, iii, and iv thus far are all made up of three waves and that W-iii and W-iv topped and bottomed at the exact Fib-extensions. Lastly, W-iv overlapped with W-i, whereas the two grey converging lines thus far contain the price action. Thus, the price action is ticking off all the ED boxes.
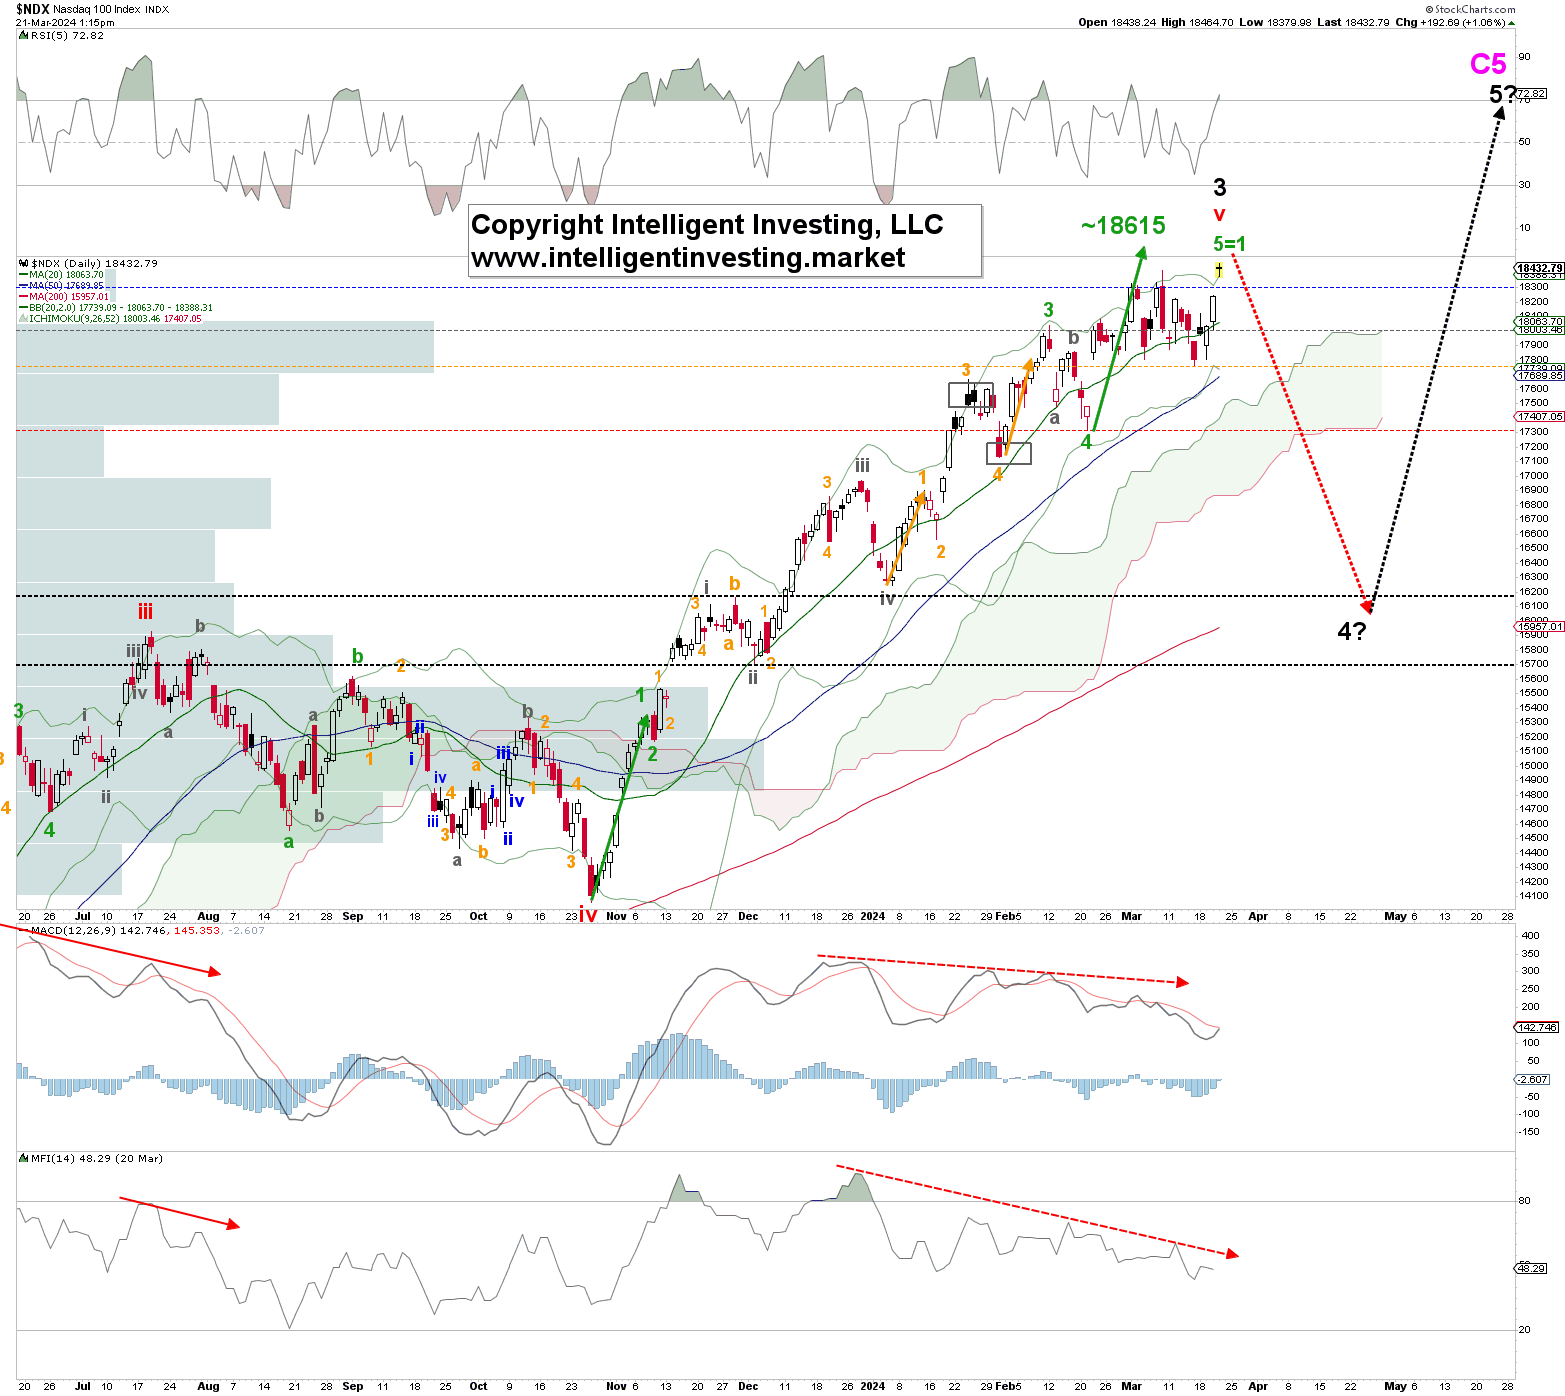 NDX Daily Chart
When we assess the daily chart, see Figure 2 above, we find that the typical W-5 = W-1 relationship targets ~$18615, close to the $18800 Fib-based level shown in Figure 1. Besides, in Figure 2, we can see that the previous orange W-5 of green W-3 was longer than the orange W-1. Thus, we can allow for a bit of an extension. Lastly, the colored dotted lines are the warning levels that will tell us if the uptrend is in jeopardy. The Bulls’ 1st warning is the blue level at $18,3000. The 2nd warning is the grey level at $18000, etc. This means that below the red warning level (the green W-4 low), the black W-4? is underway to ideally NDX15900+/-200. Lastly, please note that a break below the October 2023 low tells us the bull market is over.


