Yields Near Key Level Post Hot PPI: Is the Market Set for a Deeper Pullback?
NDX
-0.88%
Add to/Remove from Watchlist
Add to Watchlist
Add Position
Position added successfully to:
Please name your holdings portfolio
Type:
BUY
SELL
Date:
Amount:
Price
Point Value:
Leverage:
1:1
1:10
1:25
1:50
1:100
1:200
1:400
1:500
1:1000
Commission:
Create New Watchlist
Create
Create a new holdings portfolio
Add
Create
+ Add another position
Close
US500
-0.51%
Add to/Remove from Watchlist
Add to Watchlist
Add Position
Position added successfully to:
Please name your holdings portfolio
Type:
BUY
SELL
Date:
Amount:
Price
Point Value:
Leverage:
1:1
1:10
1:25
1:50
1:100
1:200
1:400
1:500
1:1000
Commission:
Create New Watchlist
Create
Create a new holdings portfolio
Add
Create
+ Add another position
Close
DX
-0.01%
Add to/Remove from Watchlist
Add to Watchlist
Add Position
Position added successfully to:
Please name your holdings portfolio
Type:
BUY
SELL
Date:
Amount:
Price
Point Value:
Leverage:
1:1
1:10
1:25
1:50
1:100
1:200
1:400
1:500
1:1000
Commission:
Create New Watchlist
Create
Create a new holdings portfolio
Add
Create
+ Add another position
Close
US10Y…
+0.37%
Add to/Remove from Watchlist
Add to Watchlist
Add Position
Position added successfully to:
Please name your holdings portfolio
Type:
BUY
SELL
Date:
Amount:
Price
Point Value:
Leverage:
1:1
1:10
1:25
1:50
1:100
1:200
1:400
1:500
1:1000
Commission:
Create New Watchlist
Create
Create a new holdings portfolio
Add
Create
+ Add another position
Close
ADBE
-13.68%
Add to/Remove from Watchlist
Add to Watchlist
Add Position
Position added successfully to:
Please name your holdings portfolio
Type:
BUY
SELL
Date:
Amount:
Price
Point Value:
Leverage:
1:1
1:10
1:25
1:50
1:100
1:200
1:400
1:500
1:1000
Commission:
Create New Watchlist
Create
Create a new holdings portfolio
Add
Create
+ Add another position
Close
NVDA
+0.08%
Add to/Remove from Watchlist
Add to Watchlist
Add Position
Position added successfully to:
Please name your holdings portfolio
Type:
BUY
SELL
Date:
Amount:
Price
Point Value:
Leverage:
1:1
1:10
1:25
1:50
1:100
1:200
1:400
1:500
1:1000
Commission:
Create New Watchlist
Create
Create a new holdings portfolio
Add
Create
+ Add another position
Close
Stocks finished the day lower following a hotter-than-expected PPI report, which sharply increased rates and the dollar, helping widen credit spreads.
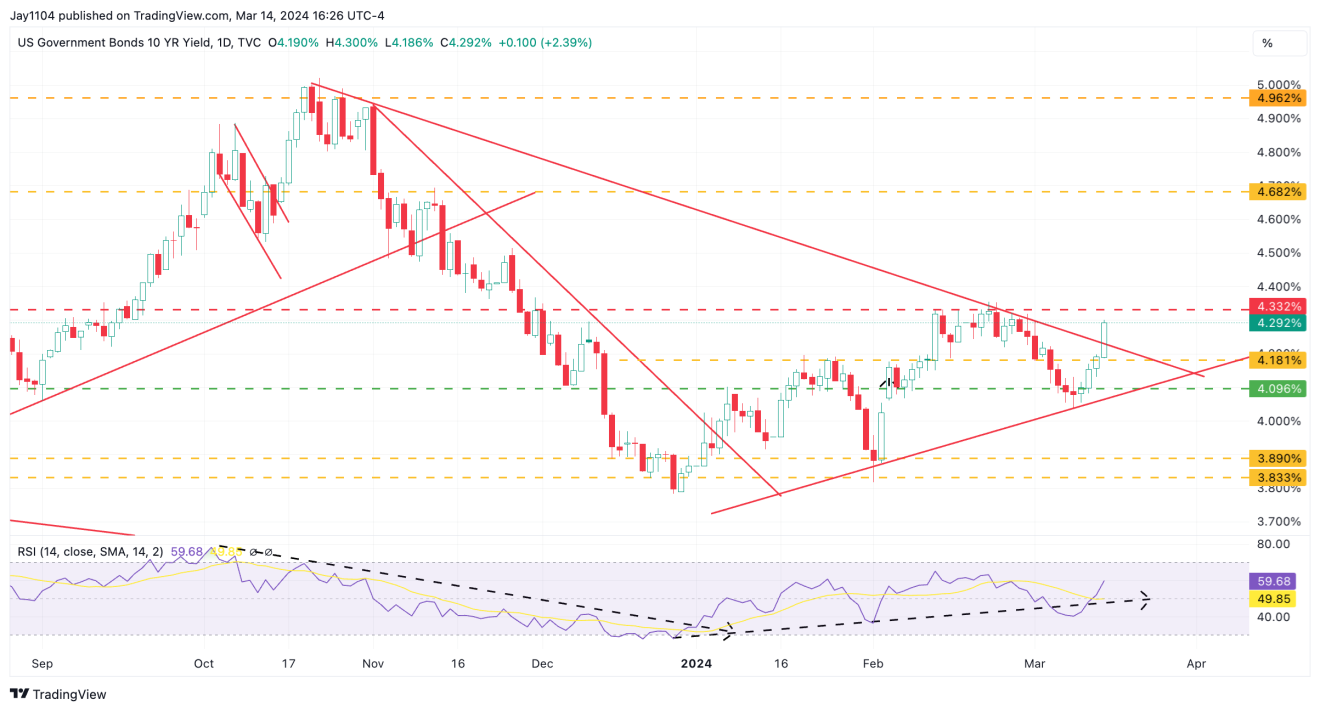
The 10-year rate rose by ten bps on the day, and that means we are again on the watch for a breach of the 4.35% level.
This level has held despite multiple attempts since the start of the year. A move beyond 4.35% is needed to intensify the equity market sell-off.
 US 10-Year Yield-Daily Chart
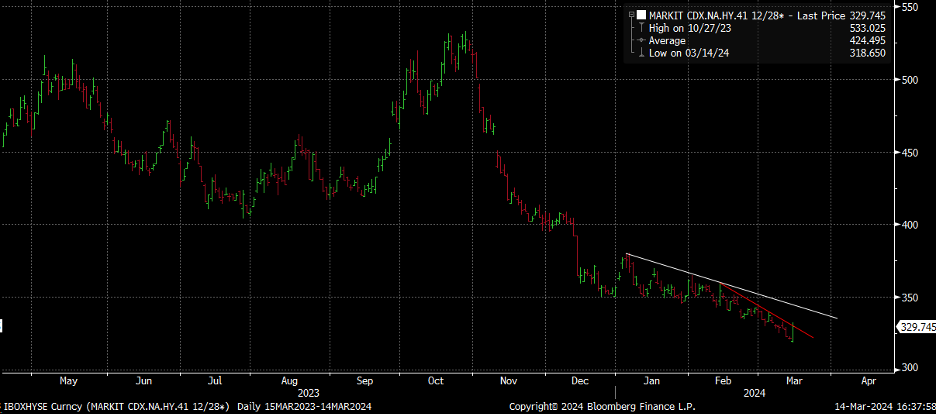
The CDX High Yield index rose 8 points yesterday to just below 330. You can’t say it has broken out at this point, but it is close.
We need to see it get above 350 before we can start to think about spread widening even more. Right now, it is just too soon. But this is something we need to watch.
 CDX High Yield Index
The S&P 500’s current earnings yield trades in lockstep with this CDX index, and so if the CDX HY index keeps going higher, then the S&P 500 earnings yield should keep going higher.
Essentially, stocks have just been a reflection of the mood for high-yield credit.
 CDX HY Index Chart
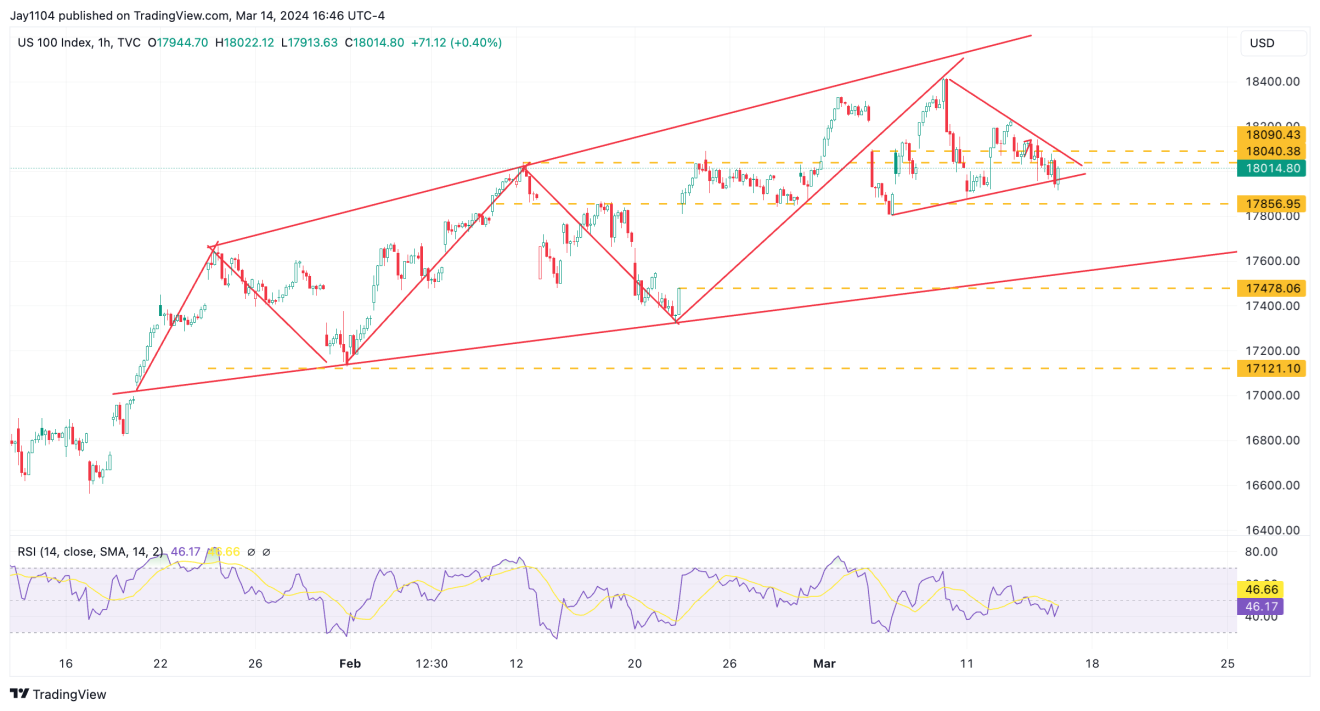
What’s odd about the equity market is that despite the big “rally” following the CPI report, the NASDAQ is down two bps points this week.
Today is OPEX, so it will probably be a busy session, but I was surprised to see that all of the gains from the “rally” are gone.
I used “rally” because, as I explained on Tuesday, the “rally” was just an implied volatility crush, and I think that point has now been proven.
I’m just waiting to see if that 17,850 level breaks and the gap from Nvidia’s (NASDAQ:NVDA) results finally gets filled.
 US 100 Index-1-Hour Chart
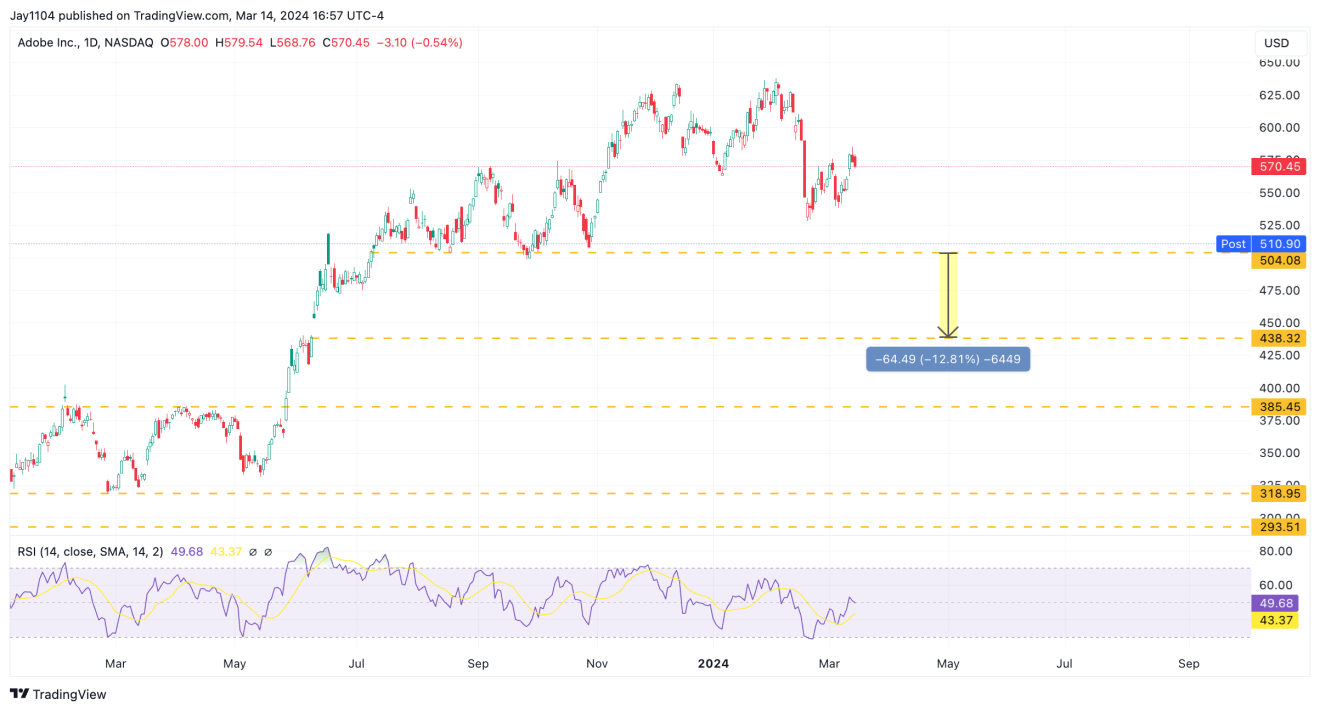
In the meantime, Adobe (NASDAQ:ADBE) won’t help today, with the shares trading down 10% after hours.
The company gave weak quarterly revenue guidance in a range of $5.25 to $5.30 billion, versus estimates of $5.31 billion, which will not cut it in this market.
The stock is trading around $510 after hours, and the level around $505 seems pretty important to the shares, with a break of support creating an opportunity for that gap to fill about 13% lower than its after-hours pricing.
 Adobe Inc-Daily Chart
Anyway, have a good one.


