NVDA
+0.70%
Add to/Remove from Watchlist
Add to Watchlist
Add Position
Position added successfully to:
Please name your holdings portfolio
Type:
BUY
SELL
Date:
Amount:
Price
Point Value:
Leverage:
1:1
1:10
1:25
1:50
1:100
1:200
1:400
1:500
1:1000
Commission:
Create New Watchlist
Create
Create a new holdings portfolio
Add
Create
+ Add another position
Close
META
+2.66%
Add to/Remove from Watchlist
Add to Watchlist
Add Position
Position added successfully to:
Please name your holdings portfolio
Type:
BUY
SELL
Date:
Amount:
Price
Point Value:
Leverage:
1:1
1:10
1:25
1:50
1:100
1:200
1:400
1:500
1:1000
Commission:
Create New Watchlist
Create
Create a new holdings portfolio
Add
Create
+ Add another position
Close
ESM24
-0.11%
Add to/Remove from Watchlist
Add to Watchlist
Add Position
Position added successfully to:
Please name your holdings portfolio
Type:
BUY
SELL
Date:
Amount:
Price
Point Value:
Leverage:
1:1
1:10
1:25
1:50
1:100
1:200
1:400
1:500
1:1000
Commission:
Create New Watchlist
Create
Create a new holdings portfolio
Add
Create
+ Add another position
Close
Market Overview: S&P 500 Emini Futures
On the weekly chart, the market has been stalling in the last 3 weeks by trading sideways and S&P 500 Emini is forming an Emini ioi breakout mode pattern (inside-outside-inside). The bulls want a breakout above, while the bears want a breakout below the inside bar. The first breakout can fail 50% of the time.
S&P 500 Emini Futures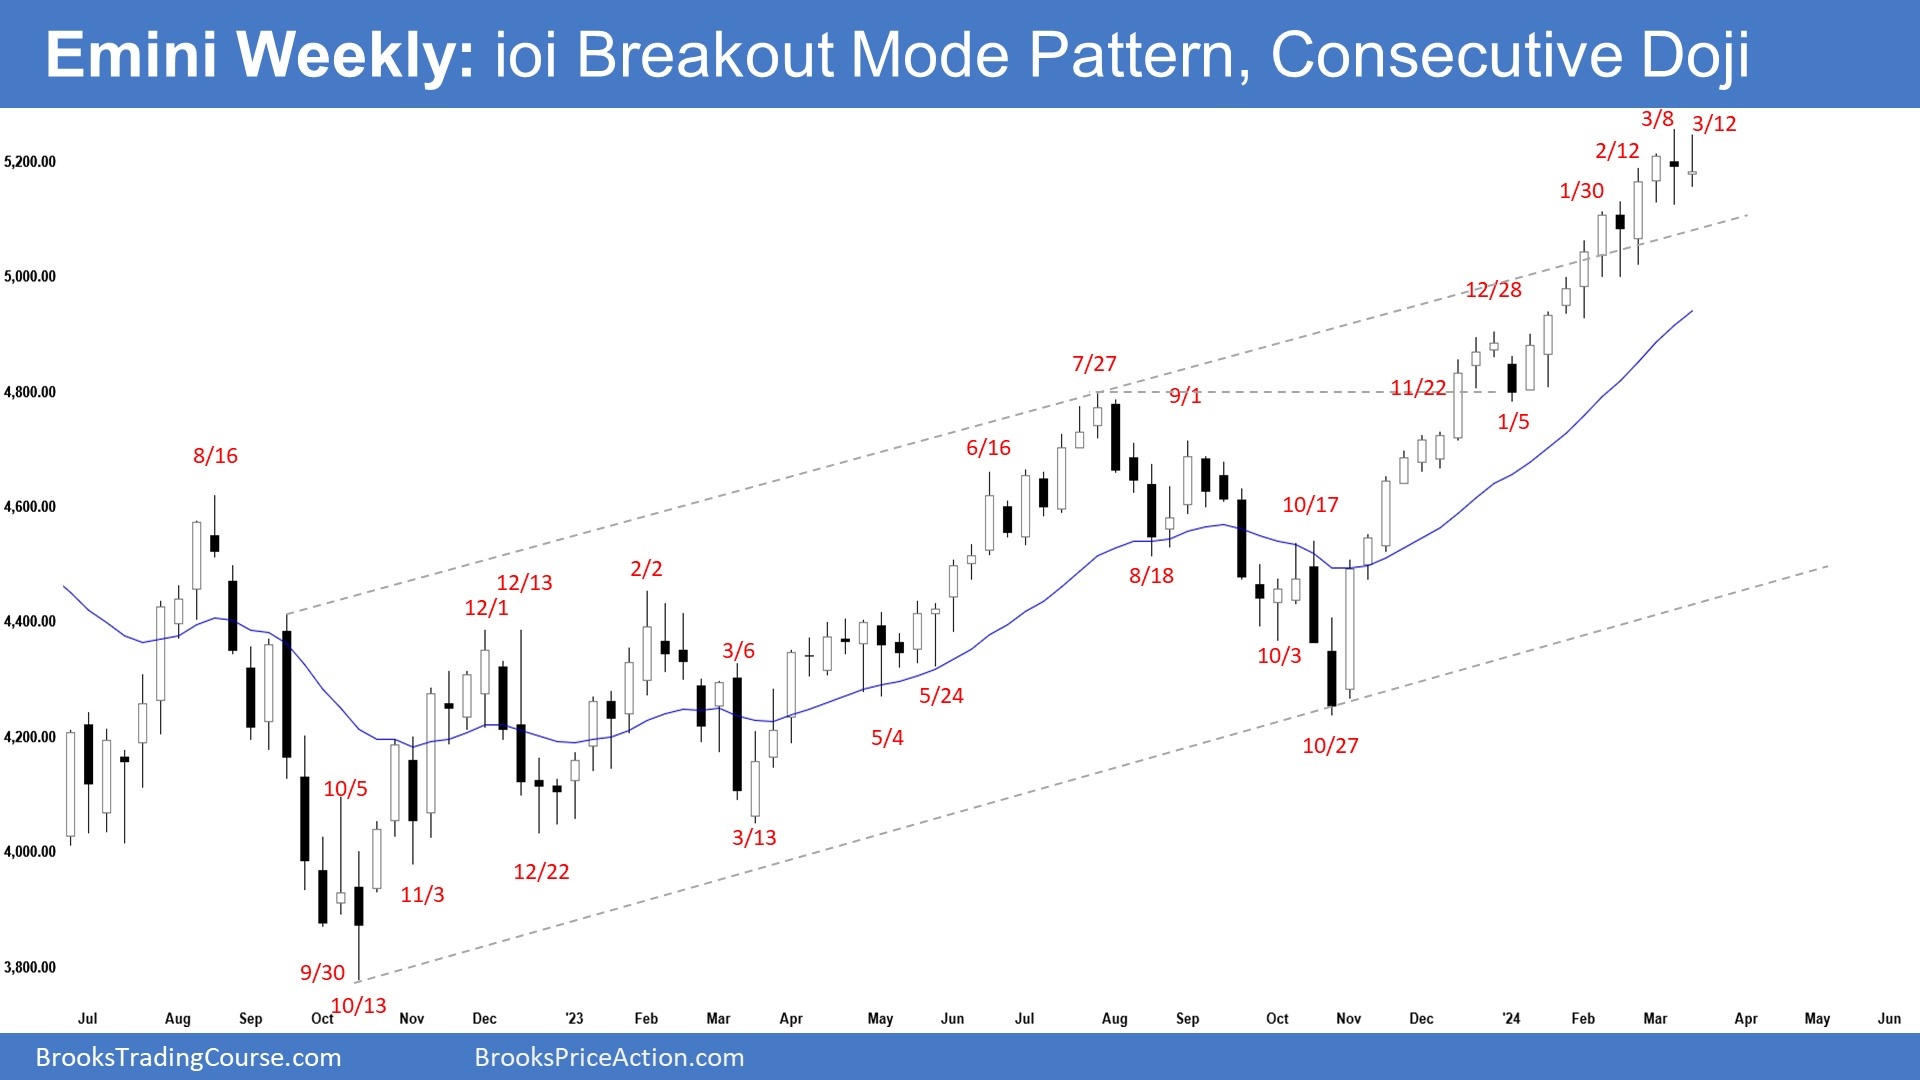

- This week’s Emini candlestick was an inside bull doji closing in the lower half of its range with a long tail above.
- Last week, we said that traders are looking for signs of profit taking but there are none still. The candlestick after an outside bar sometimes is an inside bar, forming an ioi (inside-outside-inside) breakout mode pattern.
- This week formed the ioi (inside-outside-inside) breakout mode pattern.
- The bulls have a tight bull channel. They want a strong breakout into all-time high territory, hoping that it will lead to many months of sideways to up trading after a pullback.
- They will need to continue to create sustained follow-through buying above the prior all-time high.
- Traders expect to see some profit-taking activity once the market starts to stall. The market trading sideways for the last 3 weeks is an indication of the market stalling.
- If a pullback begins, the bulls want it to be sideways and shallow, filled with bull bars, doji(s) and overlapping candlesticks.
- The bears hope that the strong rally is simply a buy-vacuum test of the prior all-time high.
- They want a reversal from a higher high major trend reversal and a large wedge pattern (Feb 2, July 27, and Mar 8). They want a failed breakout above the all-time high and the trend channel line.
- They also see a parabolic wedge in the third leg up since October (Dec 28, Jan 30, and Mar 8) and an embedded wedge (Jan 30, Feb 12, and Mar 8). This week also formed a micro double top (Mar 8 and Mar 12).
- They hope to get a TBTL (Ten Bars, Two Legs) pullback of at least 5-to-10%. They want at least a test of the 20-week EMA.
- The problem with the bear’s case is that the follow-through selling has been weak. They will need to create a few strong consecutive bear bars to indicate that they are at least temporarily back in control.
- However, once traders see a few strong bear bars, the pullback could be halfway over.
- If the market trades higher, the bears hope that the sideways tight trading range (in the last 3 weeks) will be the final flag of the rally.
- Since this week’s candlestick is an inside bar, the market has formed an ioi (inside-outside-inside) breakout mode pattern.
- The bulls want a breakout above, while the bears want a breakout below the inside bar. The first breakout can fail 50% of the time.
- The market continues to be Always In Long. However, the rally has lasted a long time and is slightly climactic.
- Traders are looking for signs of profit taking but there are none still. Until the bears can create strong bear bars, traders will not be willing to sell aggressively.
- Sometimes, a euphoric market (as it is now) can continue higher into a blow-off top (parabolic climax).
- Side note: There are signs of a blow-off top in the stocks of the leaders of the rally such as Nvidia (NASDAQ:NVDA) and Meta (NASDAQ:META).
- Traders will see if the bulls can create a breakout from the tight trading range or will the bears start to create some decent bear bars soon.
- Once the market starts to stall and traders are convinced that the profit-taking phase has begun, the selling can be strong and last at least a few weeks.
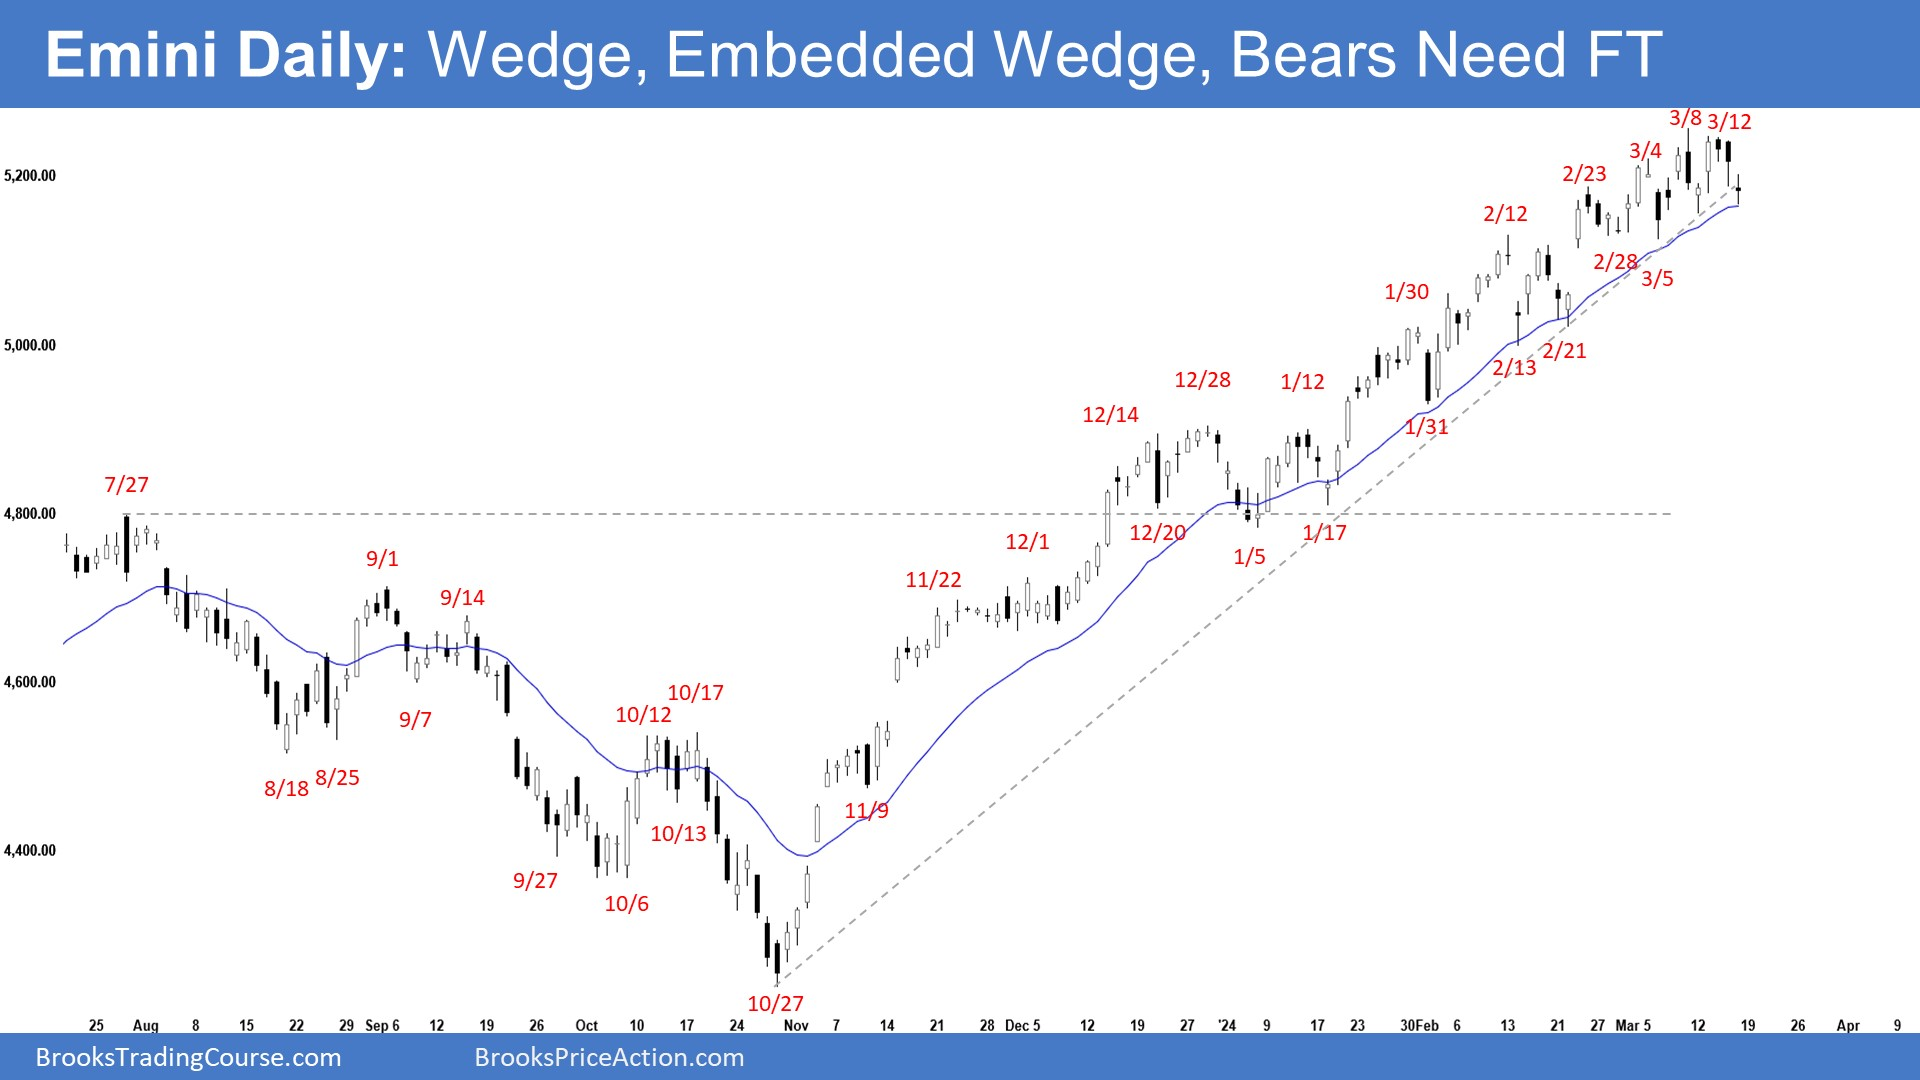
- The market broke below the outside bear bar on Monday but lacked follow-through selling. The Emini then formed a small retest of the prior high (Mar 8) but also lacked follow-through buying.
- Last week, we said that while there are no signs of strong selling pressure yet, traders should be prepared for a minor pullback which can begin at any moment.
- The bulls got a tight bull channel breaking above the prior all-time high (Jan 2022).
- They hope that the current rally will form a spike and channel which will last for many months after a deeper pullback.
- They got 3 pushes up since the January low, therefore a wedge (Jan 30, Feb 12, and Mar 8).
- The third leg up (since Feb 21 low) consists of 3 pushes (Feb 23, March 4, and March 8) therefore an embedded wedge. The risk of a profit-taking event is elevated.
- If there is a deeper pullback, the bulls want at least a small sideways to up leg to retest the current trend extreme high (now March 8).
- The bears hope that the strong rally is simply a buy vacuum retest of the prior all-time high.
- They want a reversal from a higher high major trend reversal, a large wedge pattern (Feb 2, July 27, and Mar 8) and a parabolic wedge (Dec 28, Feb 12, and Mar 8).
- They also see an embedded wedge in the current leg up (Feb 2, March 4, and March 8) and a micro double top (Mar 8 and Mar 12).
- The bears will need to create consecutive bear bars closing near their lows and trading far below the 20-day EMA and the bear trend line to indicate that they are at least temporarily back in control.
- The problem with the bear’s case is that the follow-through selling has been weak.
- They have not been able to create a breakout below the 20-day EMA. While that may change soon, until it does, there is no breakout.
- Since Friday was a bear doji, it is the first time since January that the market has closed lower for 3 consecutive days.
- The tail below the recent candlesticks indicates that the bears are not yet very strong.
- The bears need to create sustained follow-through selling trading below the 20-day EMA to start the pullback phase.
- For now, the market is still Always In Long. However, the rally has lasted a long time and is slightly climactic.
- While there are no signs of strong selling pressure yet, traders should be prepared for a minor pullback which can begin at any moment.
- Traders will see if the bulls can continue to create sustained follow-through buying above the all-time high.
- Or will the market begin the profit-taking phase soon by breaking far below the 20-day EMA?