4 Mid-Caps Ready to Soar as Markets Attempt Another ATH After CPI Report
ERIE
+1.41%
Add to/Remove from Watchlist
Add to Watchlist
Add Position
Position added successfully to:
Please name your holdings portfolio
Type:
BUY
SELL
Date:
Amount:
Price
Point Value:
Leverage:
1:1
1:10
1:25
1:50
1:100
1:200
1:400
1:500
1:1000
Commission:
Create New Watchlist
Create
Create a new holdings portfolio
Add
Create
+ Add another position
Close
SMCI
+7.66%
Add to/Remove from Watchlist
Add to Watchlist
Add Position
Position added successfully to:
Please name your holdings portfolio
Type:
BUY
SELL
Date:
Amount:
Price
Point Value:
Leverage:
1:1
1:10
1:25
1:50
1:100
1:200
1:400
1:500
1:1000
Commission:
Create New Watchlist
Create
Create a new holdings portfolio
Add
Create
+ Add another position
Close
MID
-0.45%
Add to/Remove from Watchlist
Add to Watchlist
Add Position
Position added successfully to:
Please name your holdings portfolio
Type:
BUY
SELL
Date:
Amount:
Price
Point Value:
Leverage:
1:1
1:10
1:25
1:50
1:100
1:200
1:400
1:500
1:1000
Commission:
Create New Watchlist
Create
Create a new holdings portfolio
Add
Create
+ Add another position
Close
DECK
+1.49%
Add to/Remove from Watchlist
Add to Watchlist
Add Position
Position added successfully to:
Please name your holdings portfolio
Type:
BUY
SELL
Date:
Amount:
Price
Point Value:
Leverage:
1:1
1:10
1:25
1:50
1:100
1:200
1:400
1:500
1:1000
Commission:
Create New Watchlist
Create
Create a new holdings portfolio
Add
Create
+ Add another position
Close
CELH
+6.75%
Add to/Remove from Watchlist
Add to Watchlist
Add Position
Position added successfully to:
Please name your holdings portfolio
Type:
BUY
SELL
Date:
Amount:
Price
Point Value:
Leverage:
1:1
1:10
1:25
1:50
1:100
1:200
1:400
1:500
1:1000
Commission:
Create New Watchlist
Create
Create a new holdings portfolio
Add
Create
+ Add another position
Close
- The 10 largest stocks account for 33% of the S&P 500’s market capitalization, up from 27% at the peak of the tech bubble in 2000.
- Meanwhile, the S&P 400 has been performing better than the other indexes this year and has a more diversified stock weightage.
- In this piece, we will take a look at 4 stocks that could make a great addition to your portfolio.
- Investing in the stock market and looking to get the most out of your portfolio? Try InvestingPro+! Sign up HERE and take advantage of up to 38% off your 1-year plan for a limited time!
Last year and in 2024, the media has mainly focused on big companies that grab most of the headlines. But there’s more to the stock market than just these giants.
Today, I want to introduce you to a set of stocks from the S&P Midcap 400. This index consists of 400 mid-sized companies.
Mid-cap companies fall in the range of market cap between $2 billion and $10 billion.
According to data available from 1994 to 2020, it has outperformed both the S&P 500 and the S&P 600.
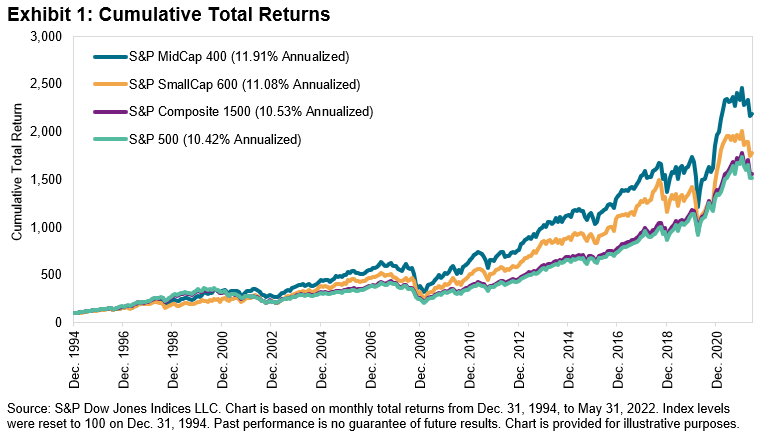 Total Returns
And here we can see the most recent comparison between the S&P 500 and the S&P 400.
 S&P 500 Vs. S&P 400
The S&P 500 has a more intense concentration of stocks compared to the S&P 400.
Nvidia (NASDAQ:NVDA)’s market value makes up almost 5% of the S&P 500. Currently, the top 10 stocks contribute to 33% of the index’s total market value, which is higher than the 27% observed during the peak of the tech bubble in 2000.
Now, let’s explore some intriguing stocks in the S&P 400 MidCap. I’ll utilize InvestingPro to gather essential information and data about these companies.
1. Super Micro Computer
Super Micro Computer (NASDAQ:SMCI) is a technology company specializing in high-end servers, networking devices, and workstations. The company was incorporated in 1993 and is based in San Jose, California.
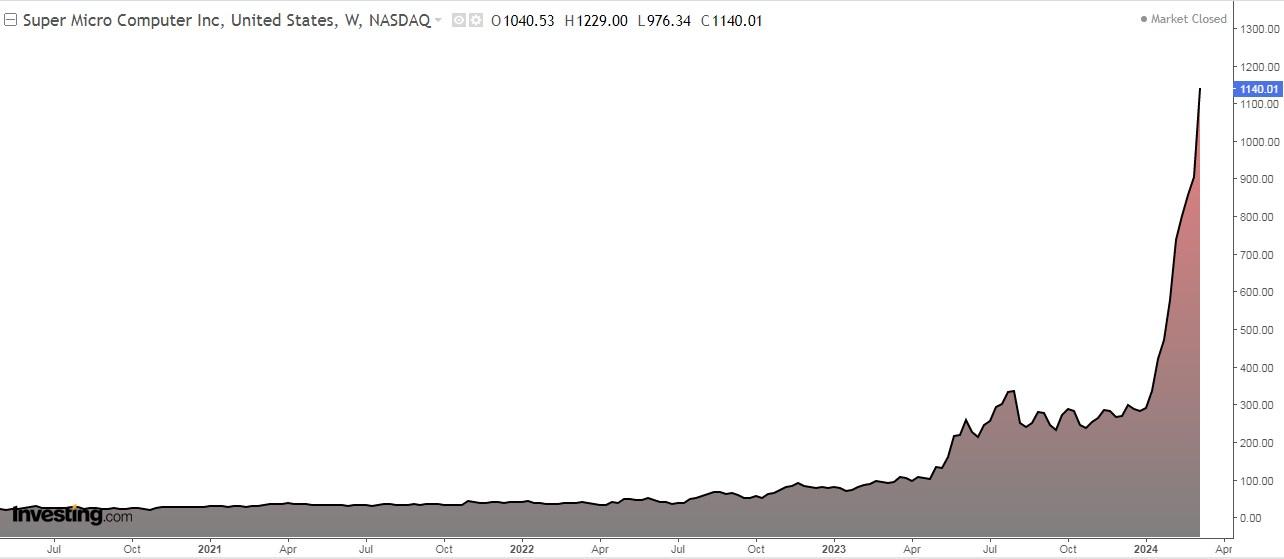 Super Micro Computer Price Chart
On April 30 we will know its accounts. Earnings per share (EPS) are expected to increase by +146.22% and revenue by +104%.
 Super Micro Computer Earnings
Super Micro is experiencing accelerating revenue and, in particular, earnings growth as demand for its servers and computing solutions expands rapidly. It has been growing earnings at an average annual rate of +53% in recent years.
Note also the operating leverage that is contributing to margin expansion and rapidly accelerating earnings per share.
The market knows its shares are not cheap, but believes the near- and long-term growth prospects justify the investment at current levels.
 Super Micro Computer News
With data at the close of the week, over the last 12 months, its shares are up +1056%, and over the last three months +334%.
2. Deckers Outdoor
Deckers Outdoor Corporation (NYSE:DECK) designs and markets footwear, apparel and accessories in the United States and internationally. It was founded in 1973 and is headquartered in Goleta, California.
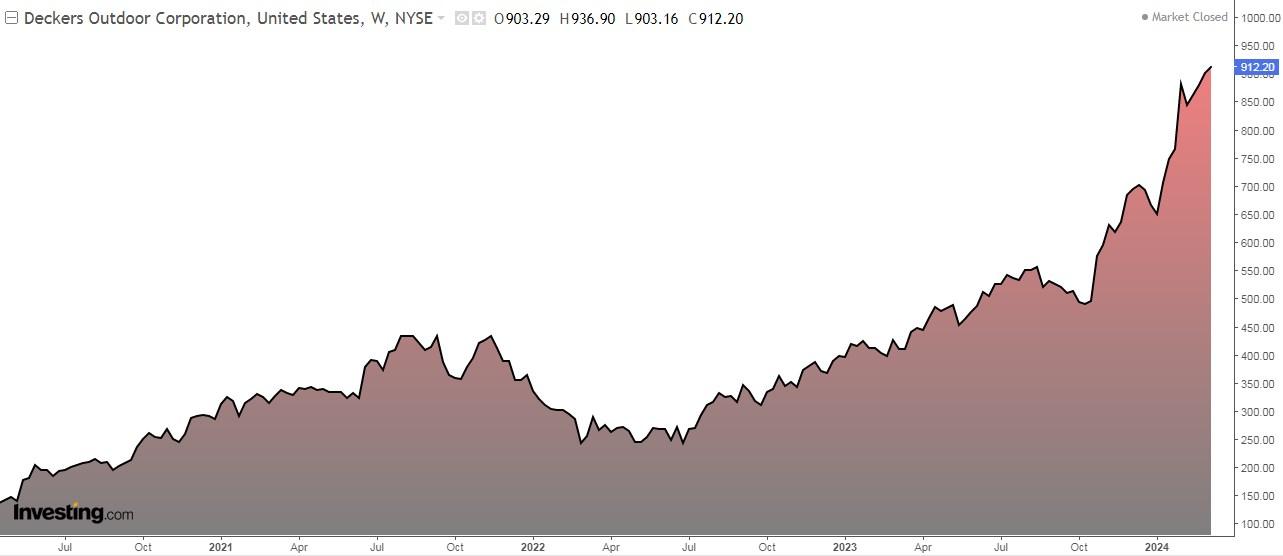 Deckers Outdoor Chart
It will release its numbers on May 23 and is expected to increase revenues by +7.81%.
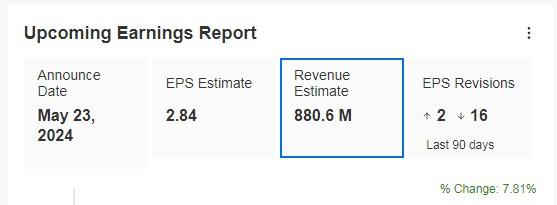 Deckers Outdoor Earnings
Deckers’ brands are experiencing significant gains, which contrasts with the loss for example Nike (NYSE:NKE).
It presents a solid financial profile. Capitalization stands at $23.43 billion, reflecting its significant industry presence.
It has a price-to-earnings ratio of 32.75, suggesting that investors are willing to pay a premium for its earnings potential.
This is supported by the company’s strong revenue growth. The gross profit margin is +54.43%, indicating efficient cost management and a solid pricing strategy.
 Deckers Outdoor News
With data at the close of the week, over the last 12 months, its shares are up +115.34%, and over the last three months +30.71%.
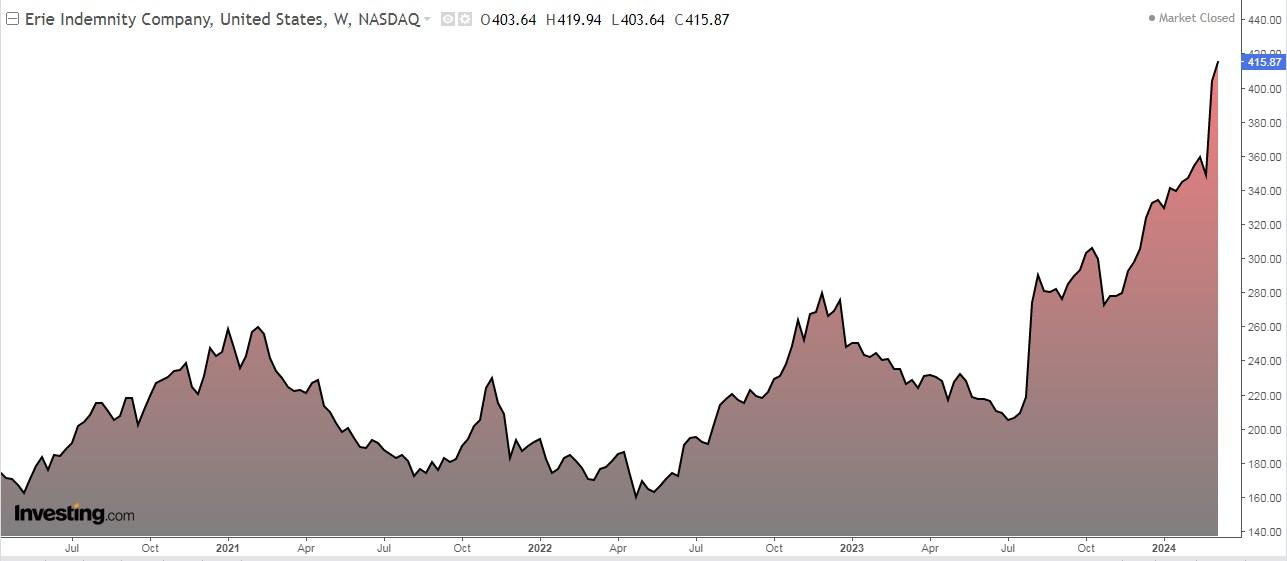
3. Erie Indemnity
Erie Indemnity Company (NASDAQ:ERIE) is a home, accident, car, and life insurance company. The company was incorporated in 1925 and is headquartered in Erie, Pennsylvania.
 Erie Indemnity Chart
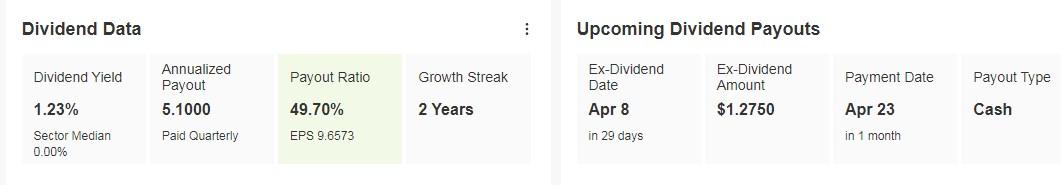
It distributes a dividend of $1.27 on April 23 and to be eligible to receive it you must own shares before April 8.
 Erie Indemnity Targets
It releases its earnings release on April 25 and earnings per share (EPS) is expected to increase by +42.94%.
 Erie Indemnity Earnings
The company’s strong quarterly and year-over-year performance was driven by premium growth, as well as increased management fee income.
Investors like the company’s bullish earnings outlook for this year. The company is forecast to earn $10.09 per share in 2024, up +15% from 2023.
With data at the close of the week, over the last 12 months, its shares are up +84.51%, and over the last three months +30.80%.
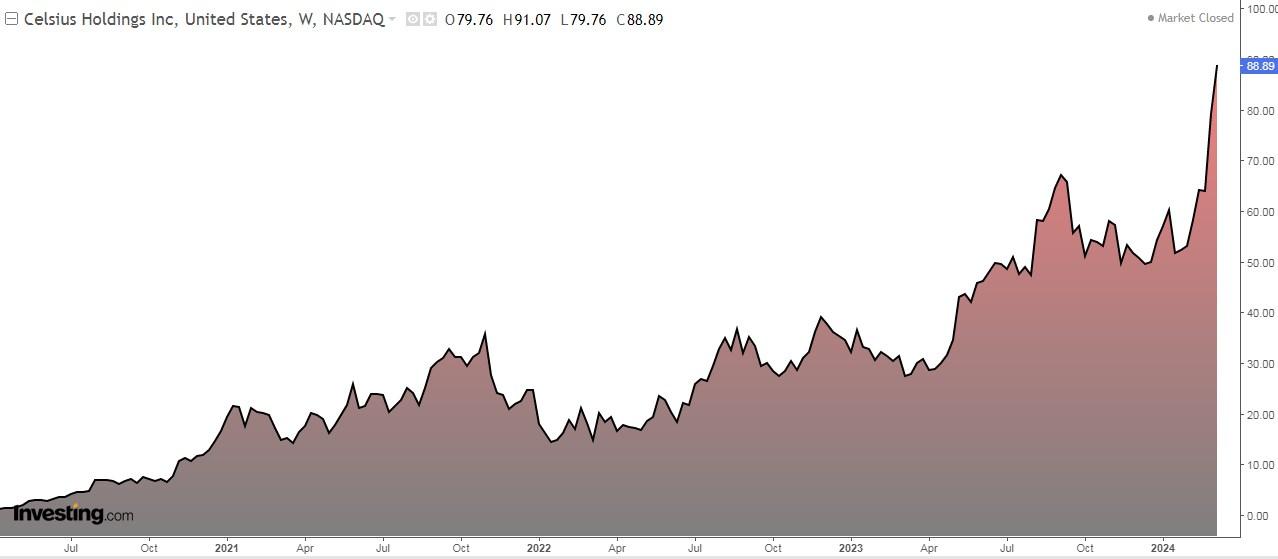
4. Celsius Holdings
Celsius Holdings (NASDAQ:CELH) develops and markets energy drinks in the United States, Canada, Europe, and Asia-Pacific.
It was formerly known as Vector Ventures and changed its name in January 2007. It was founded in 2004 and is based in Boca Raton, Florida.
 Celsius Holdings Chart
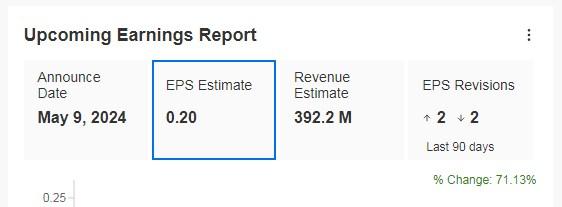
It will report its results on May 9 and is expected to report earnings per share (EPS) up +71.13% and revenue up +29.67%.
 Celsius Holdings Earnings
The market applauds that growth is supported by the nationwide launch of ‘Essentials’, a new product extension, which will be fully rolled out in May.
The company’s gross profit margin of +48.04% indicates a strong ability to translate sales into profits, a key factor in sustaining its growth trajectory.
With data at the close of the week, over the last 12 months, its shares are up +206.52%, and over the last three months +78.89%.
***
Do you invest in the stock market? When and how to enter or exit? Try InvestingPro!
Take advantage of it HERE AND NOW! Click HERE, choose the plan you want for 1 or 2 years, and take advantage of your DISCOUNTS. Get from 10% to 50% by applying the code INVESTINGPRO1. Don’t wait any longer!
With it, you will get:
- ProPicks: AI-managed portfolios of stocks with proven performance.
- ProTips: digestible information to simplify a large amount of complex financial data into a few words.
- Advanced Stock Finder: Search for the best stocks based on your expectations, taking into account hundreds of financial metrics.
- Historical financial data for thousands of stocks: So that fundamental analysis professionals can delve into all the details themselves.
- And many other services, not to mention those we plan to add in the near future.
Act fast and join the investment revolution – get your OFFER HERE!
 Subscribe Today!
Act fast and join the investment revolution – get your OFFER HERE!
Disclaimer:


