Nasdaq, S&P 500 Might Retreat Before Resuming Higher; Russell 2000 Eyes Breakout
US500
+0.32%
Add to/Remove from Watchlist
Add to Watchlist
Add Position
Position added successfully to:
Please name your holdings portfolio
Type:
BUY
SELL
Date:
Amount:
Price
Point Value:
Leverage:
1:1
1:10
1:25
1:50
1:100
1:200
1:400
1:500
1:1000
Commission:
Create New Watchlist
Create
Create a new holdings portfolio
Add
Create
+ Add another position
Close
US2000
+1.09%
Add to/Remove from Watchlist
Add to Watchlist
Add Position
Position added successfully to:
Please name your holdings portfolio
Type:
BUY
SELL
Date:
Amount:
Price
Point Value:
Leverage:
1:1
1:10
1:25
1:50
1:100
1:200
1:400
1:500
1:1000
Commission:
Create New Watchlist
Create
Create a new holdings portfolio
Add
Create
+ Add another position
Close
IWM
+1.14%
Add to/Remove from Watchlist
Add to Watchlist
Add Position
Position added successfully to:
Please name your holdings portfolio
Type:
BUY
SELL
Date:
Amount:
Price
Point Value:
Leverage:
1:1
1:10
1:25
1:50
1:100
1:200
1:400
1:500
1:1000
Commission:
Create New Watchlist
Create
Create a new holdings portfolio
Add
Create
+ Add another position
Close
IXIC
+0.20%
Add to/Remove from Watchlist
Add to Watchlist
Add Position
Position added successfully to:
Please name your holdings portfolio
Type:
BUY
SELL
Date:
Amount:
Price
Point Value:
Leverage:
1:1
1:10
1:25
1:50
1:100
1:200
1:400
1:500
1:1000
Commission:
Create New Watchlist
Create
Create a new holdings portfolio
Add
Create
+ Add another position
Close
The Nasdaq started brightly but ended up closing below its open price but above the day before yesterday’s close. The S&P 500 did something similar, although the intraday range is narrower.
These two setups are somewhat complicated by the new ‘buy’ triggers in On-Balance-Volume for both the Nasdaq and S&P 500.
And the new MACD trigger ‘buy’ for the S&P 500. Price action is key, so I would expect the candlestick to trump the technical picture; watch for lower prices today.
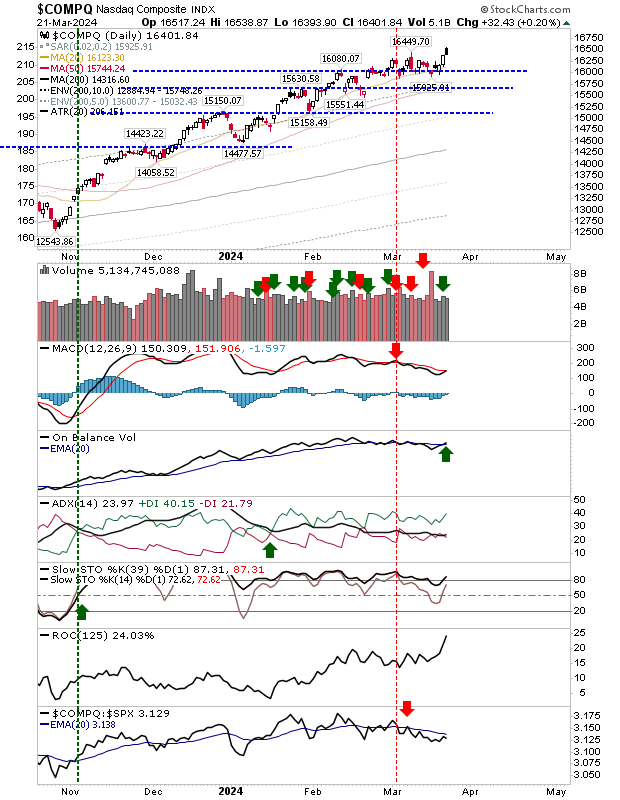 COMPQ-Daily Chart
The S&P 500 posted a relative bearish shift versus the Russell 2000 (IWM) but the trend is firmly bullish.
 SPX-Daily Chart
The Russell 2000 ($IWM) gapped higher but stalled out at resistance. As with peer indexes, there was an acceleration in On-Balance-Volume accumulation, but there is also the existing ‘sell’ trigger in the MACD.
The setup is not as bearish as for the Nasdaq and S&P 500, and there is potential for a breakout.
 IWM-Daily Chart
Given the relative divergence between action in the Russell 2000 ($IWM) and S&P 500 and Nasdaq, the probable net result will be a flat day where indexes go nowhere. Let’s see what the market brings.


