Crude Oil – Verification of Breakout?
CL
-0.10%
Add to/Remove from Watchlist
Add to Watchlist
Add Position
Position added successfully to:
Please name your holdings portfolio
Type:
BUY
SELL
Date:
Amount:
Price
Point Value:
Leverage:
1:1
1:10
1:25
1:50
1:100
1:200
1:400
1:500
1:1000
Commission:
Create New Watchlist
Create
Create a new holdings portfolio
Add
Create
+ Add another position
Close
We could summarize the recent price action in crude oil in one word: tests. What’s next?
Technical Picture of Crude Oil
Crude oil closed last week above the previously broken Dec. 2023 peak and the barrier of $80. Did it change much in the medium- and short-term picture of the commodity? In today’s article, I share with you my thoughts on this subject. Have a nice read.
 Crude Oil Chart
 Crude Oil Chart
Let’s start with quotes from Friday’s Oil Trading Alert:
From today’s point of view, we see that the situation developed in tune with the above scenario and crude oil moved a bit lower during Friday’s session.
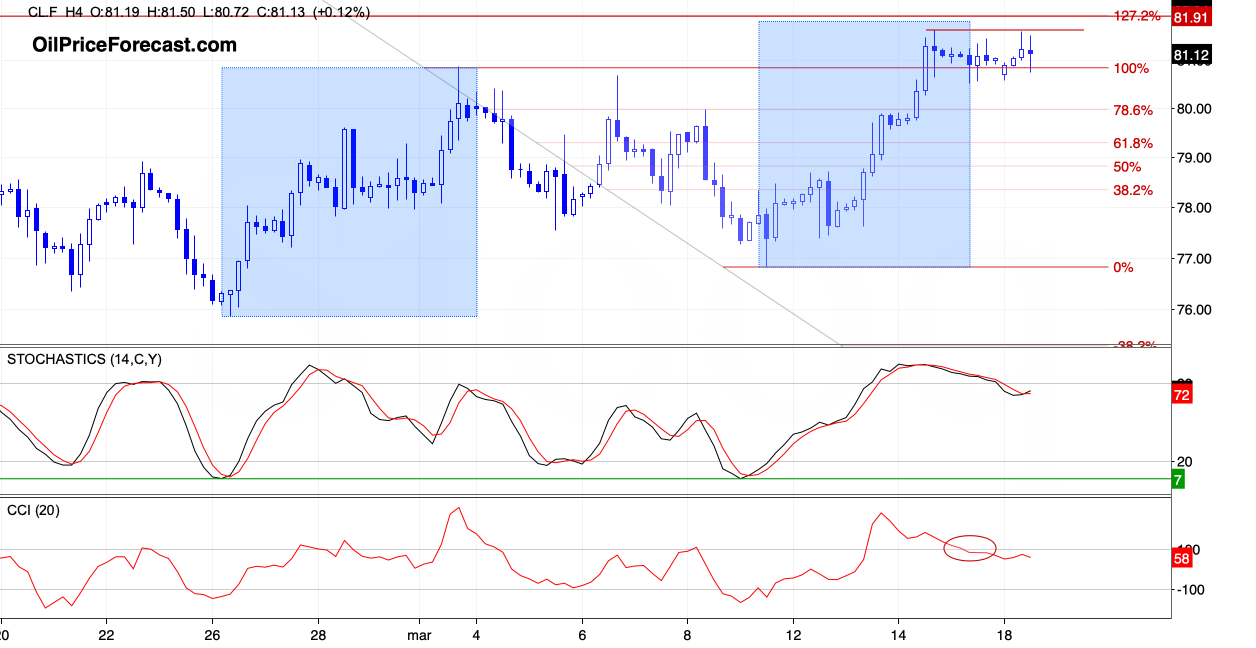
As you see, the commodity started the day below Thursday’s closing price, creating a gap ($80.58-$81.26) that now serves as the nearest resistance. This deterioration encouraged the sellers to test the previously broken barrier of $80, but the support withstood the selling pressure, which resulted in a comeback to the opening price.
Thanks to this price action, market participants created a doji candlestick on the chart, which suggests some indecisions – especially when we factor in the smallest volume in March (which indicates that the involvement in shaping subsequent candles decreases from session to session).
A Pro-Declining Gap
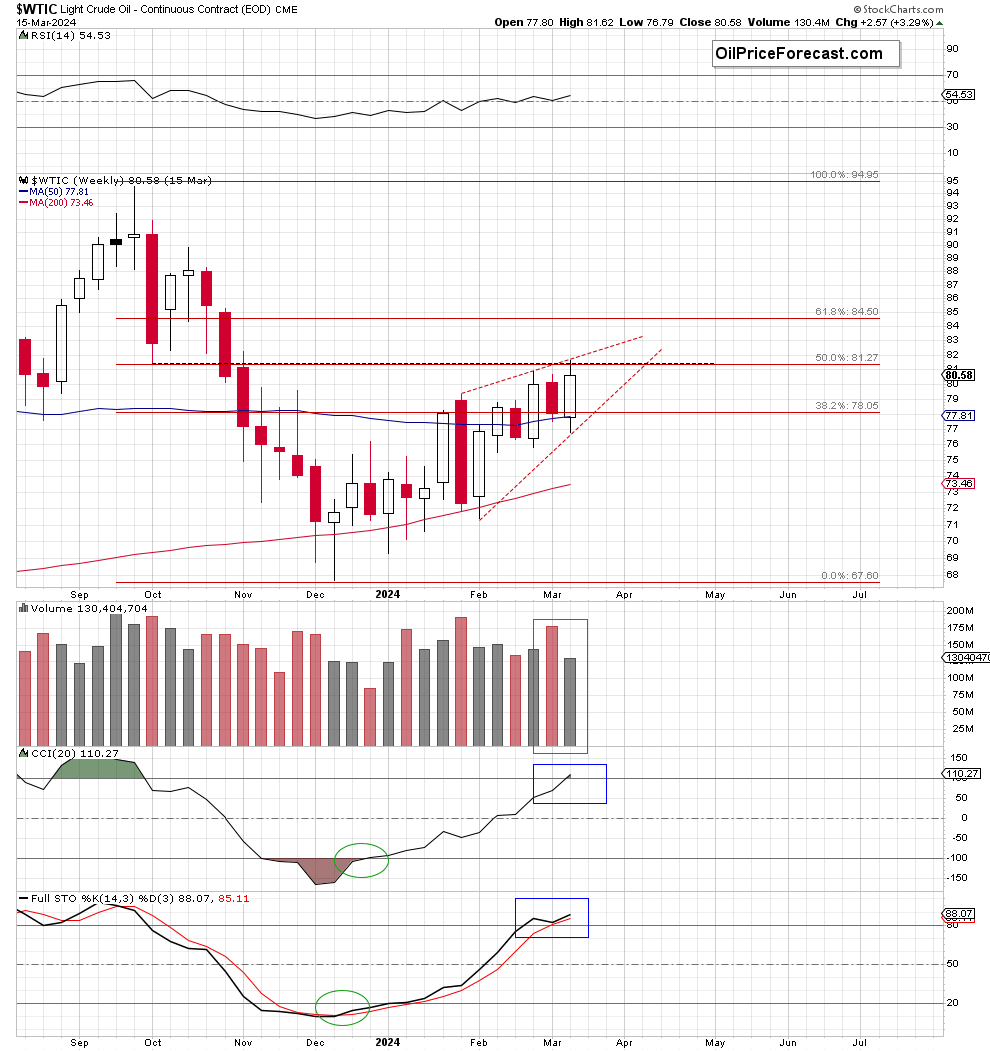
And speaking of the volume… last week’s candlestick materialized on a smaller volume than the previous declining red candle, which doesn’t confirm oil bulls’ strength, suggesting that another attempt to move lower may be just around the corner.
Taking all the above into account, and combining it with the current situation in the 4-hour chart, I believe that the recent commentary on black gold is up to date also today:
 Crude Oil Chart
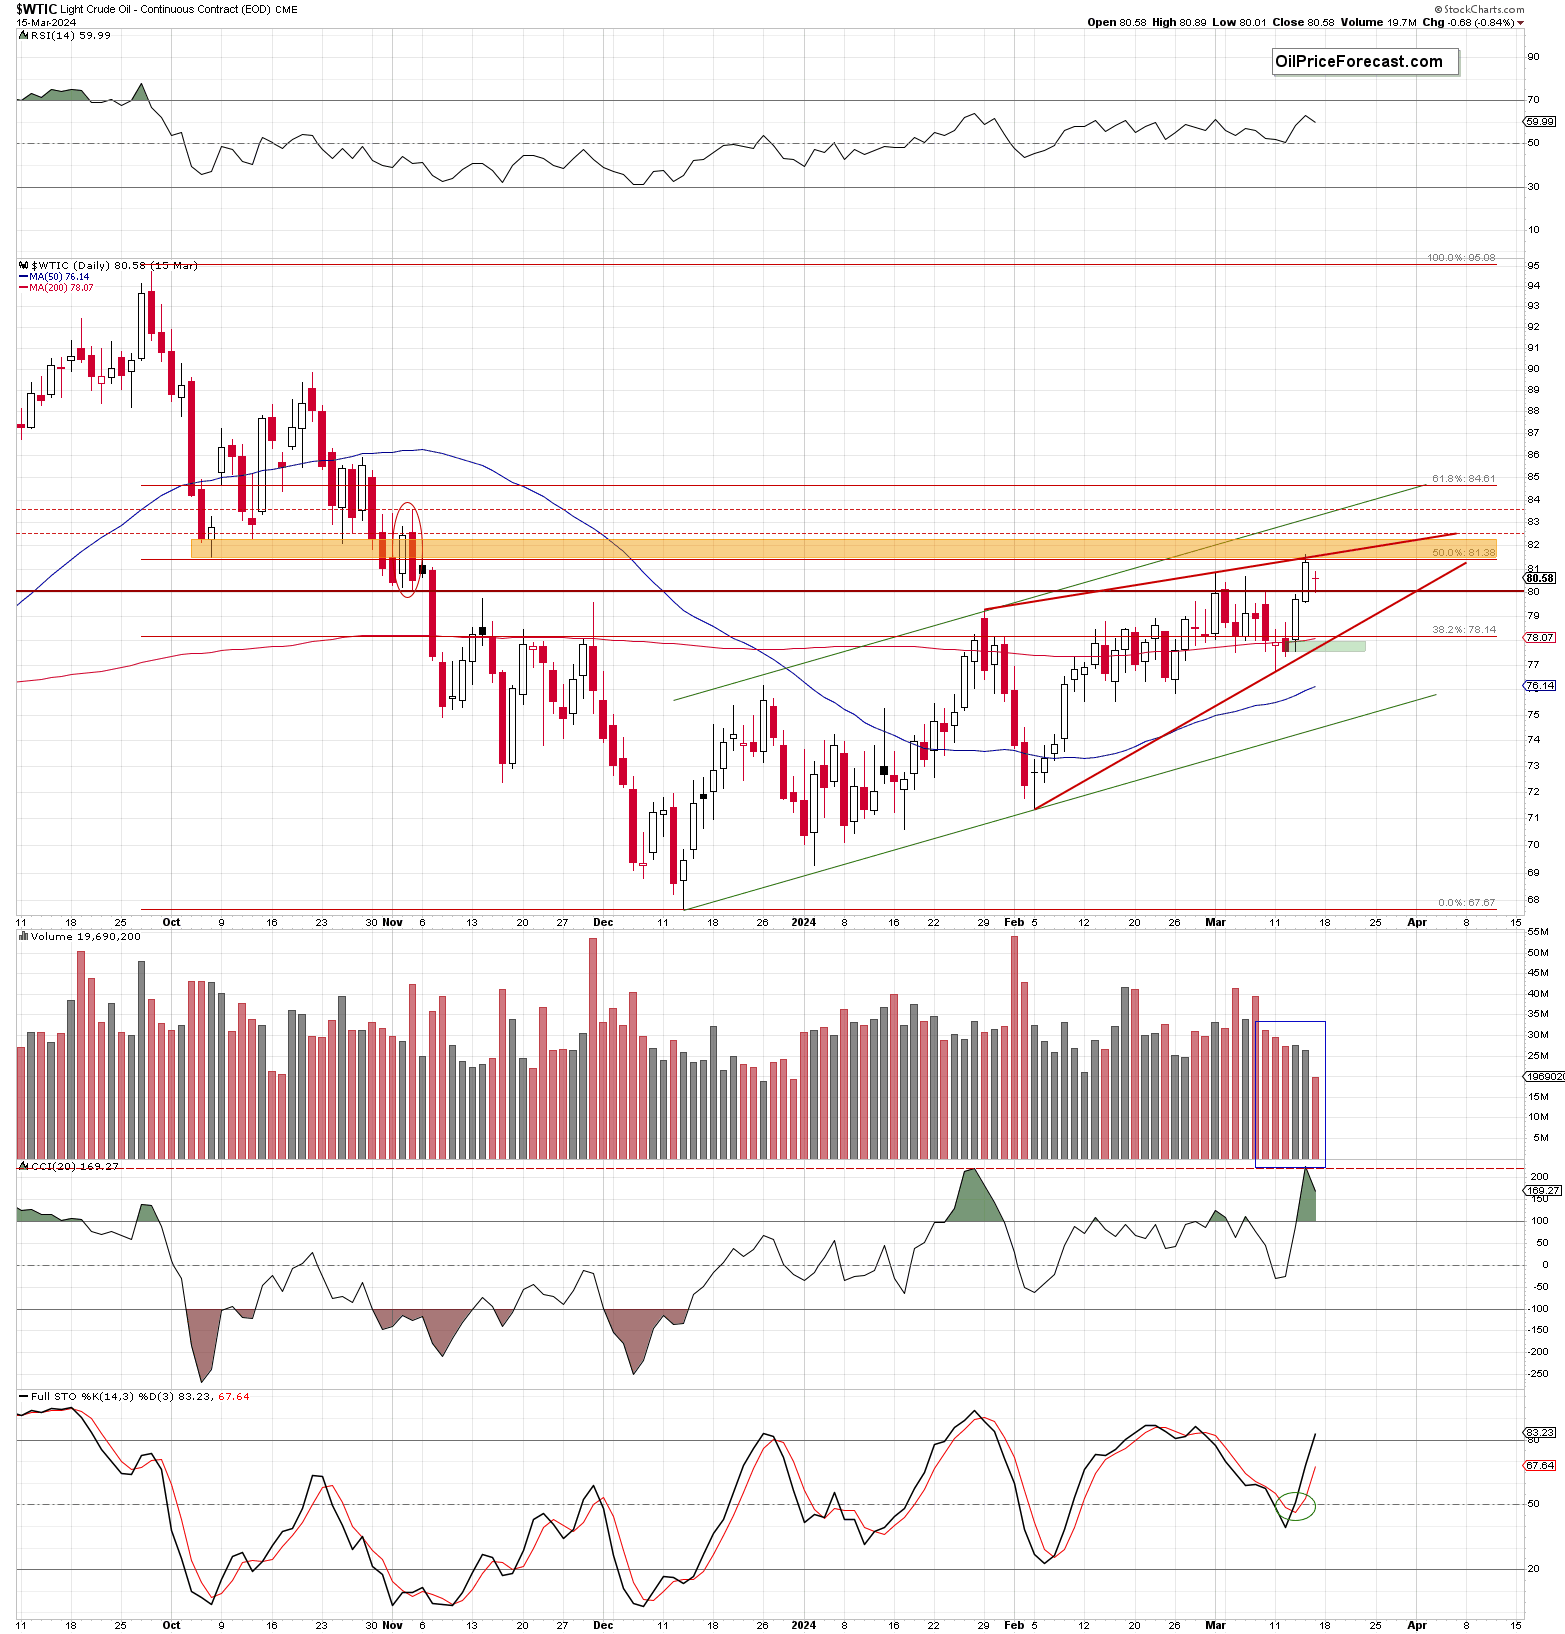
Summing up, crude oil closed another day above the previous peak and the barrier of $80, but despite this positive development, Friday’s session started with the pro-declining gap, which continues to serve as the nearest resistance. Additionally, the technical picture (the nearest resistance zone, the similarity of the upward moves, the current position of the daily and weekly indicators, and the disappointing volume (not only daily, but also weekly) suggests that the space for further increases seems limited and a reversal is just around the corner.


