Gold: Fake Breakout Suggests Continued Decline for Yellow Metal
XAU/USD
-0.74%
Add to/Remove from Watchlist
Add to Watchlist
Add Position
Position added successfully to:
Please name your holdings portfolio
Type:
BUY
SELL
Date:
Amount:
Price
Point Value:
Leverage:
1:1
1:10
1:25
1:50
1:100
1:200
1:400
1:500
1:1000
Commission:
Create New Watchlist
Create
Create a new holdings portfolio
Add
Create
+ Add another position
Close
Gold
-0.83%
Add to/Remove from Watchlist
Add to Watchlist
Add Position
Position added successfully to:
Please name your holdings portfolio
Type:
BUY
SELL
Date:
Amount:
Price
Point Value:
Leverage:
1:1
1:10
1:25
1:50
1:100
1:200
1:400
1:500
1:1000
Commission:
Create New Watchlist
Create
Create a new holdings portfolio
Add
Create
+ Add another position
Close
In my previous article, I set an upper limit for gold futures at $2227, with volatility peaking before last Wednesday and Thursday’s FOMC meeting.
On March 21, 2024, gold futures made a significant move, starting at the day’s low of $2152.50, a key support level, and reaching a high of $2225 on expectations of lower interest rates in the months ahead.
While Fed Chair Jerome Powell acknowledged some recent inflationary pressures, the broader narrative of easing inflation persisted. Coupled with Fed officials forecasting a 75 basis point interest rate decrease by the end of 2024, this favored bullish sentiment for gold.
This scenario could attract further selling pressure if gold futures breach the critical support at $2148 in the upcoming week.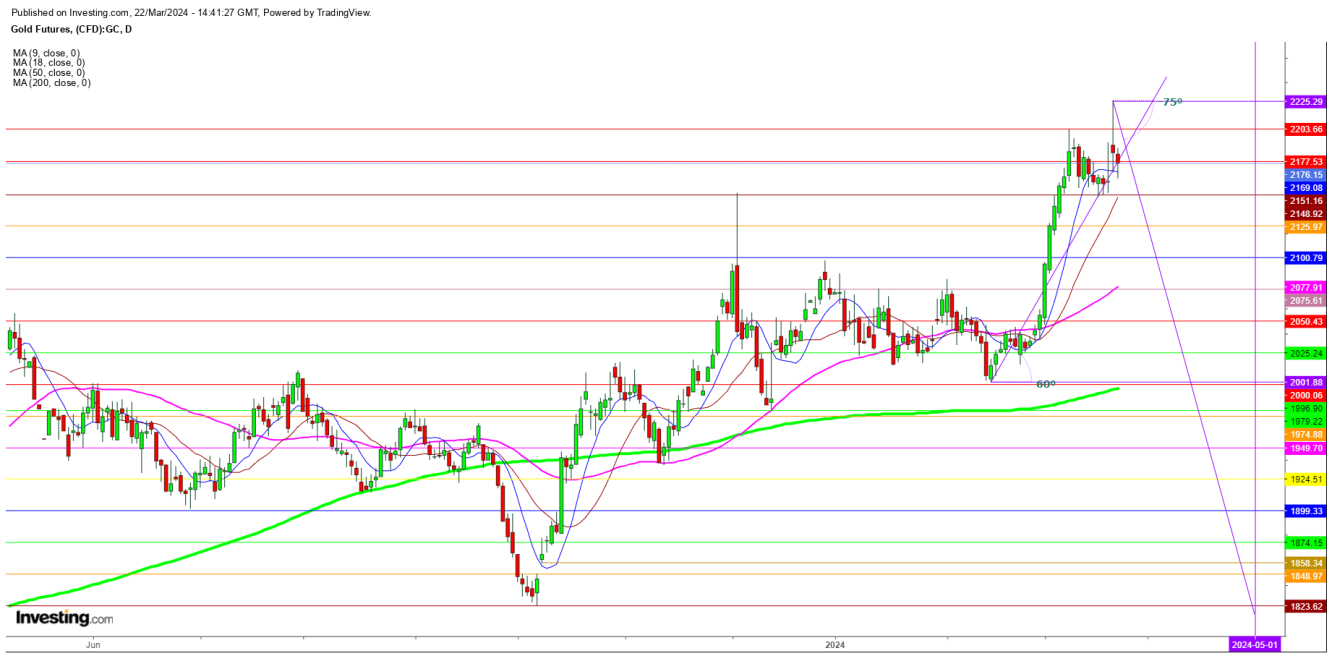 Gold Futures Daily Chart
In the daily chart, gold futures have maintained the 9-day moving average (DMA) at $2168, which has led to increasing suspicion among traders since March 21, 2024.
The exhaustive candle formed on March 21, 2024, was followed by a bearish candle on March 22, confirming that the sell-off is likely to persist if gold futures close below the 9 DMA on the daily chart this week.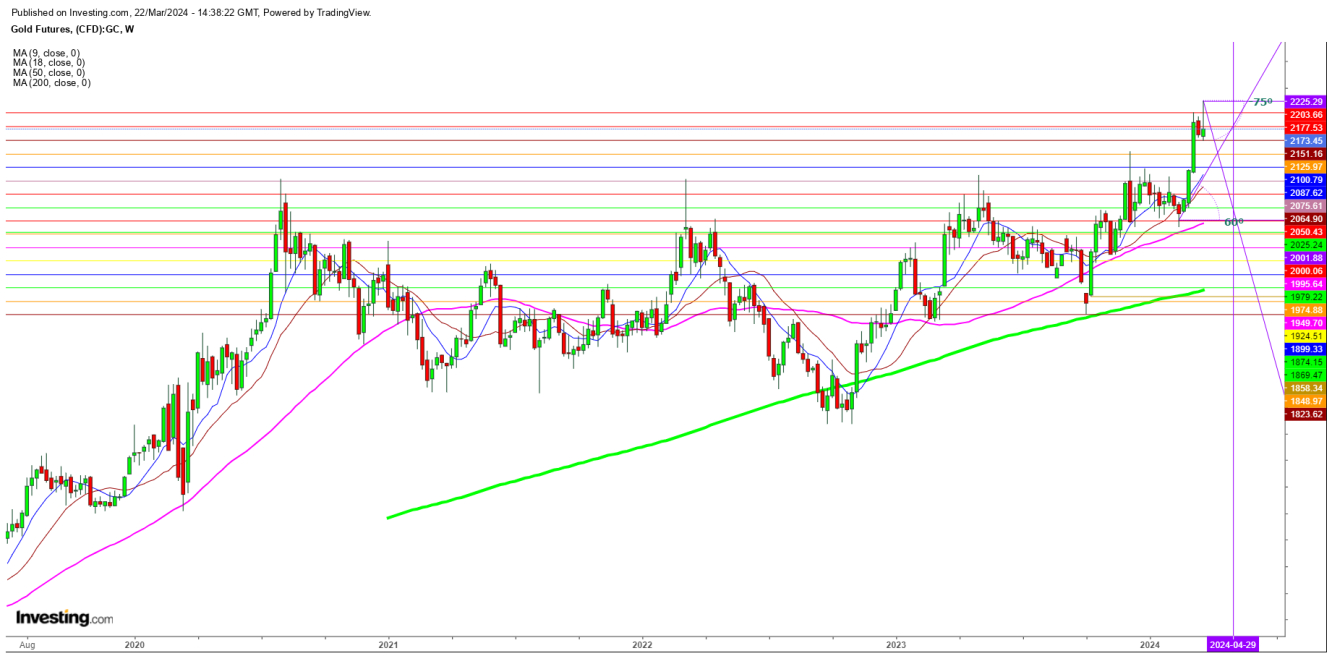 Gold Futures Weekly Chart
In the weekly chart, gold futures have formed a bearish hammer, which could be confirmed next week if they break below the key support level at $2151.
In conclusion, the outlook for gold traders may remain uncertain until the Fed’s next two meetings. Any upward movement above the immediate resistance at $2189 could present a shorting opportunity for gold futures, with a second short position possibly taken above the second resistance at $2222.
Conversely, gold futures could decline to the significant support level of $2077 until the Fed makes a definitive directional move.
Disclaimer:
Disclaimer:


