Russell 2000 Reverses off Resistance; Nasdaq, S&P 500 Still Net Bullish
US500
-0.14%
Add to/Remove from Watchlist
Add to Watchlist
Add Position
Position added successfully to:
Please name your holdings portfolio
Type:
BUY
SELL
Date:
Amount:
Price
Point Value:
Leverage:
1:1
1:10
1:25
1:50
1:100
1:200
1:400
1:500
1:1000
Commission:
Create New Watchlist
Create
Create a new holdings portfolio
Add
Create
+ Add another position
Close
US2000
-1.27%
Add to/Remove from Watchlist
Add to Watchlist
Add Position
Position added successfully to:
Please name your holdings portfolio
Type:
BUY
SELL
Date:
Amount:
Price
Point Value:
Leverage:
1:1
1:10
1:25
1:50
1:100
1:200
1:400
1:500
1:1000
Commission:
Create New Watchlist
Create
Create a new holdings portfolio
Add
Create
+ Add another position
Close
IWM
-1.38%
Add to/Remove from Watchlist
Add to Watchlist
Add Position
Position added successfully to:
Please name your holdings portfolio
Type:
BUY
SELL
Date:
Amount:
Price
Point Value:
Leverage:
1:1
1:10
1:25
1:50
1:100
1:200
1:400
1:500
1:1000
Commission:
Create New Watchlist
Create
Create a new holdings portfolio
Add
Create
+ Add another position
Close
IXIC
+0.16%
Add to/Remove from Watchlist
Add to Watchlist
Add Position
Position added successfully to:
Please name your holdings portfolio
Type:
BUY
SELL
Date:
Amount:
Price
Point Value:
Leverage:
1:1
1:10
1:25
1:50
1:100
1:200
1:400
1:500
1:1000
Commission:
Create New Watchlist
Create
Create a new holdings portfolio
Add
Create
+ Add another position
Close
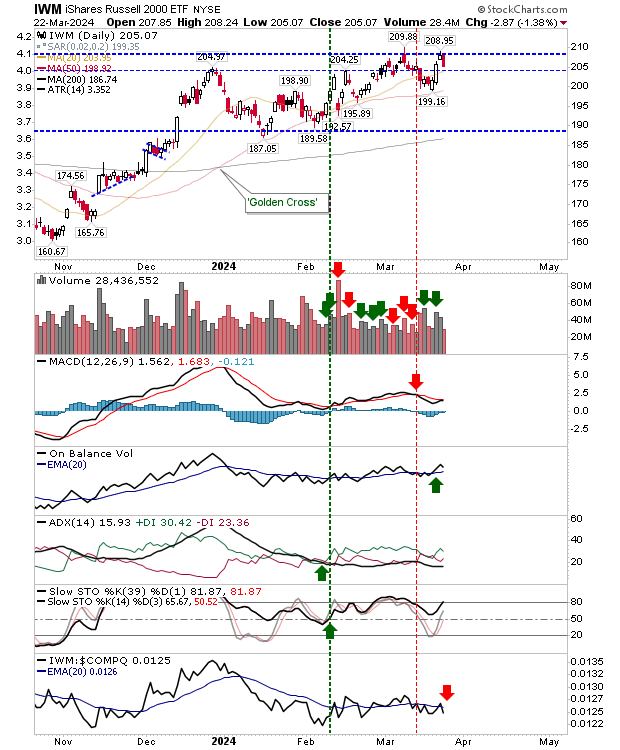
The Russell 2000 (IWM) has shaped a four-month cup-and-handle pattern, but Friday’s challenge of handle resistance was not enough to generate the follow-through needed to continue the rally.
Despite the losses, On-Balance-Volume remains on a ‘buy’ trigger and the MACD has the potential to offer a ‘buy’ trigger of its own on the next gain. However, losses did reverse relative performance away from Small Caps to the Nasdaq. IWM-Daily Chart
The Nasdaq banked a small gain Friday on trading volume which was lighter than normal. While price action gathered little attention, there was a return to net bullish technicals with a new MACD trigger ‘buy’ to go alongside the earlier ‘buy’ signal in On-Balance-Volume.
Thursday’s bearish black candlestick was not good to see, but Friday didn’t deliver the losses such a candlestick can deliver. I have added a support trendline that will offer itself as an additional buy zone. Momentum is strongly bullish.
 COMPQ-Daily Chart
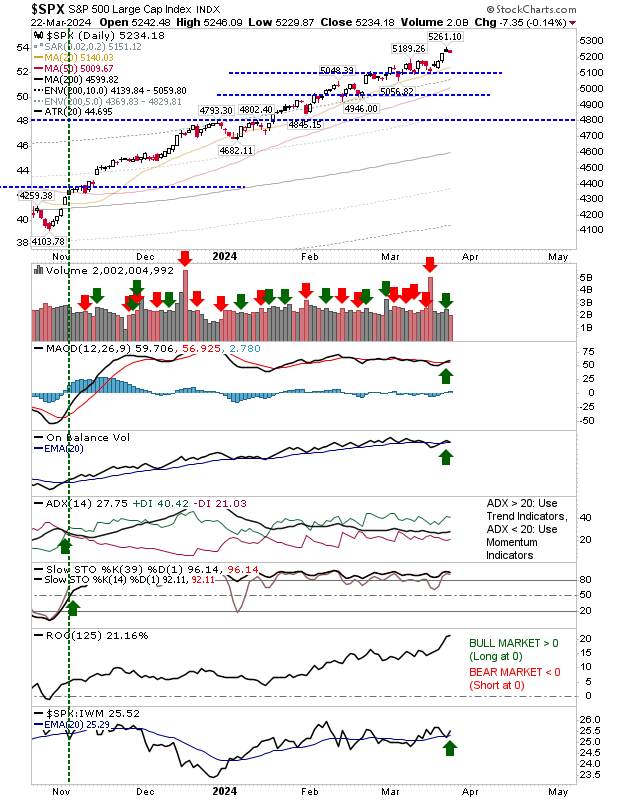
The S&P had the weaker ‘black’ candlestick but finished Friday with a narrow range day loss, again, not the kind of loss feared.
With the larger loss in the Russell 2000, we now have a return to relative leadership in the Large Caps index. Since October 2023 this index has barely skipped a beat, and Friday’s loss didn’t change that.
 S&P 500-Daily Chart
While we may yet see an acceleration of losses today, current action doesn’t suggest any increasing doubt on the part of bulls, and the steadiness of the rally means excessive greed isn’t a factor either.


