WTI Crude Oil Breakout Buy Signal: Levels to Watch
XAU/USD
+0.24%
Add to/Remove from Watchlist
Add to Watchlist
Add Position
Position added successfully to:
Please name your holdings portfolio
Type:
BUY
SELL
Date:
Amount:
Price
Point Value:
Leverage:
1:1
1:10
1:25
1:50
1:100
1:200
1:400
1:500
1:1000
Commission:
Create New Watchlist
Create
Create a new holdings portfolio
Add
Create
+ Add another position
Close
XAG/USD
+1.28%
Add to/Remove from Watchlist
Add to Watchlist
Add Position
Position added successfully to:
Please name your holdings portfolio
Type:
BUY
SELL
Date:
Amount:
Price
Point Value:
Leverage:
1:1
1:10
1:25
1:50
1:100
1:200
1:400
1:500
1:1000
Commission:
Create New Watchlist
Create
Create a new holdings portfolio
Add
Create
+ Add another position
Close
Gold
+0.19%
Add to/Remove from Watchlist
Add to Watchlist
Add Position
Position added successfully to:
Please name your holdings portfolio
Type:
BUY
SELL
Date:
Amount:
Price
Point Value:
Leverage:
1:1
1:10
1:25
1:50
1:100
1:200
1:400
1:500
1:1000
Commission:
Create New Watchlist
Create
Create a new holdings portfolio
Add
Create
+ Add another position
Close
Silver
+1.11%
Add to/Remove from Watchlist
Add to Watchlist
Add Position
Position added successfully to:
Please name your holdings portfolio
Type:
BUY
SELL
Date:
Amount:
Price
Point Value:
Leverage:
1:1
1:10
1:25
1:50
1:100
1:200
1:400
1:500
1:1000
Commission:
Create New Watchlist
Create
Create a new holdings portfolio
Add
Create
+ Add another position
Close
CL
-0.58%
Add to/Remove from Watchlist
Add to Watchlist
Add Position
Position added successfully to:
Please name your holdings portfolio
Type:
BUY
SELL
Date:
Amount:
Price
Point Value:
Leverage:
1:1
1:10
1:25
1:50
1:100
1:200
1:400
1:500
1:1000
Commission:
Create New Watchlist
Create
Create a new holdings portfolio
Add
Create
+ Add another position
Close
Gold XAU/USD
- XAU/USD trades in a sideways consolidation to ease severely overbought conditions. I had warned that this was possible and it is perfectly normal after a swift move higher.
- Yesterday we recovered Wednesday’s losses and we are still holding within Tuesday’s range.
- Gold is likely to trade sideways for a little longer. We have minor resistance at the 2-day high at 2180/84. A weekly close above the all-time high of 2195 should be a buy signal for the start of next week.
- We are waiting for prices to fall as far as a buying opportunity at 2147/42. If we reach this level today, longs need stops below 2137.
- A break below 2136 however risks a slide to 2225, perhaps as far as 2020.
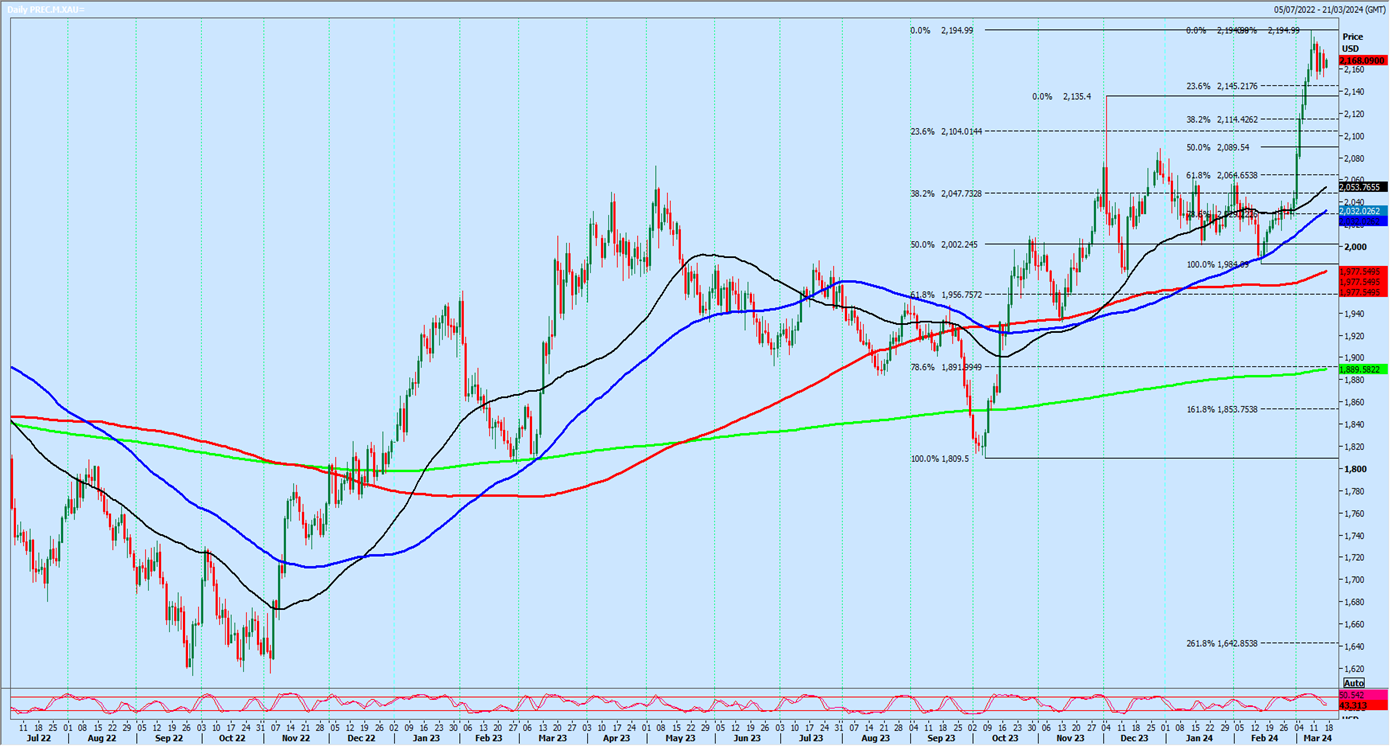 Gold-Daily Chart
Silver XAG/USD should find support at 2445/2435 on any correction to the downside and longs need stops below 2420
Targets: 2480 and 2510.
WTI Crude April Future
- WTI Crude finally made a breakout above 7970/8000 and also the more important March highs at 8045/8085.
- It looks like we are sustaining a break above 8100 for a buy signal targeting 8130/50 (hit yesterday) then 8200/8230. In fact even 8400/8450 is a realistic target if you want to try running a small position as far as this target in the days ahead.
A weekly close below 8000 would make me question whether this breakout can be sustained next week.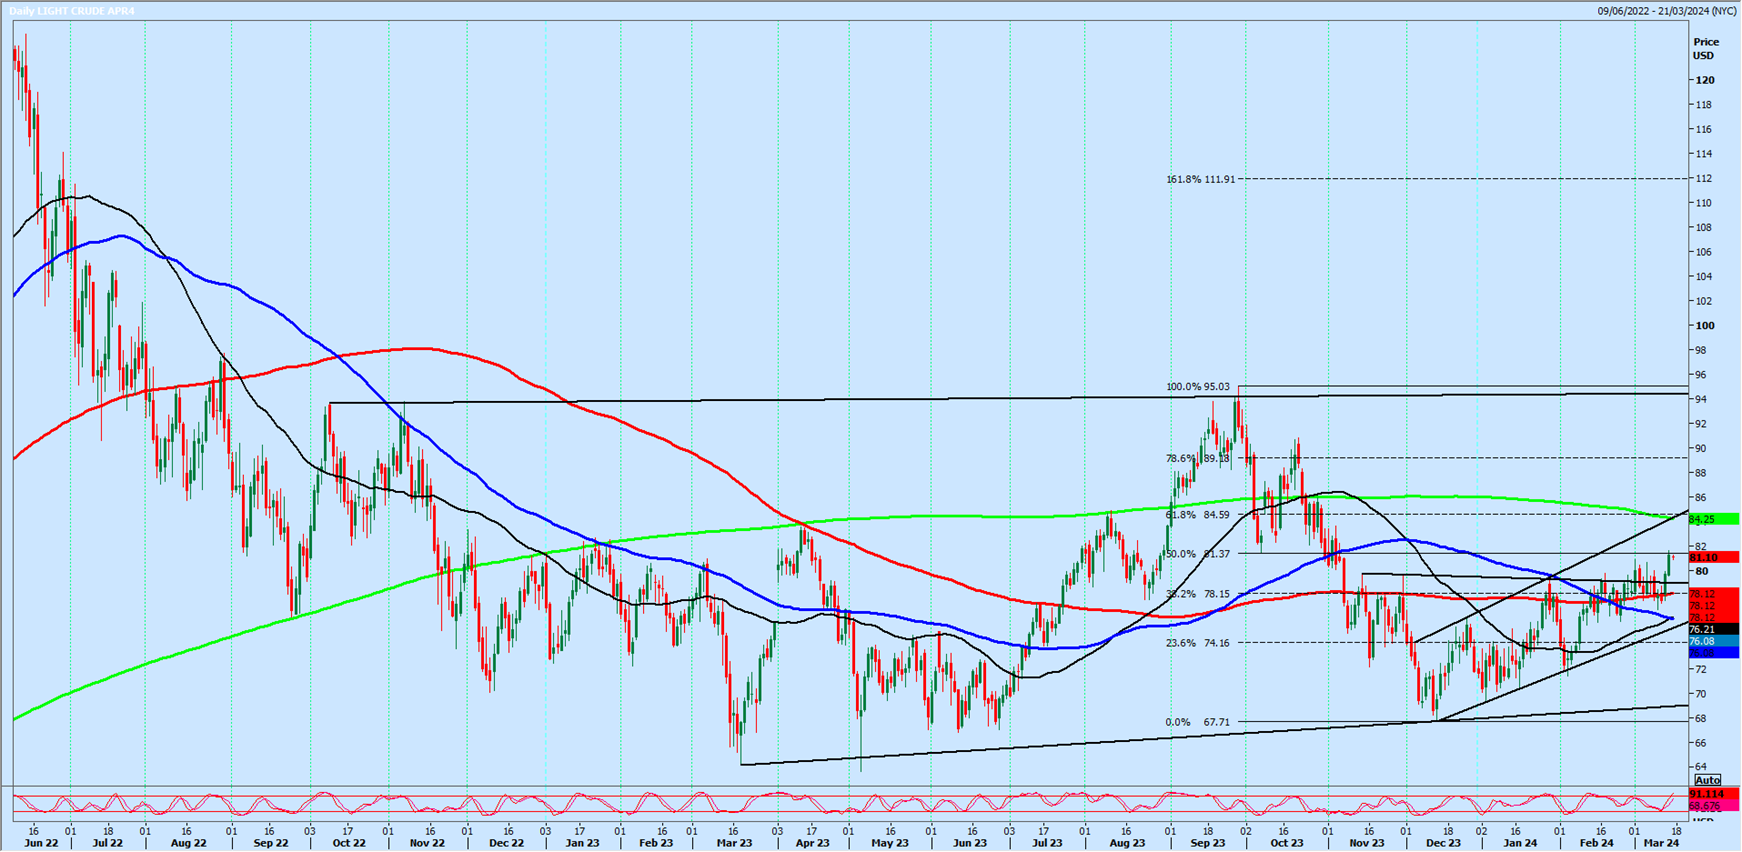 WTI-Daily Chart


